Which two filter modes can you use with continuous filters? Choose two.
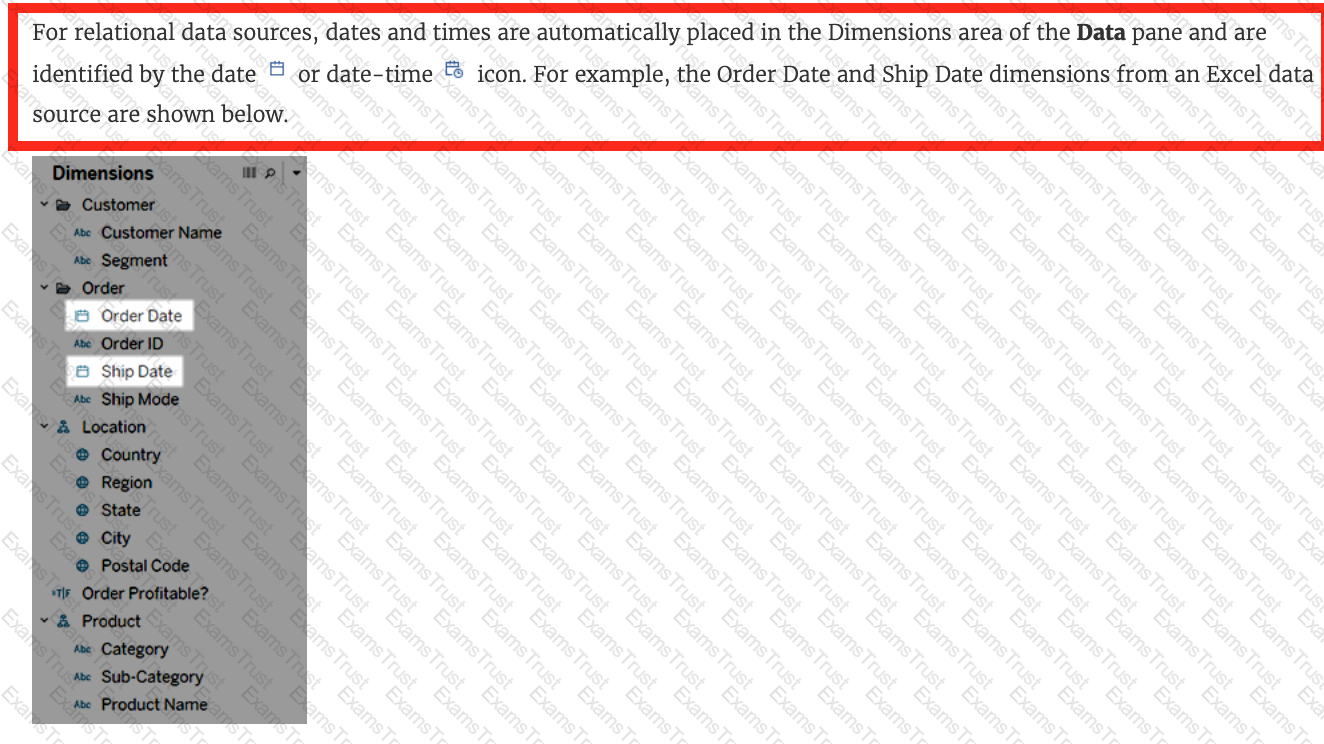
You want to provide additional information when hovering over a field in the Data pane as shown in the following exhibit.
What should you configure for the field?
What are two requirements to combine two tables by using a union? Choose two.
What are two use cases for creating hierarchies from the Data pane? Choose two.
Most viewers scan content starting at the _____________ of a page.
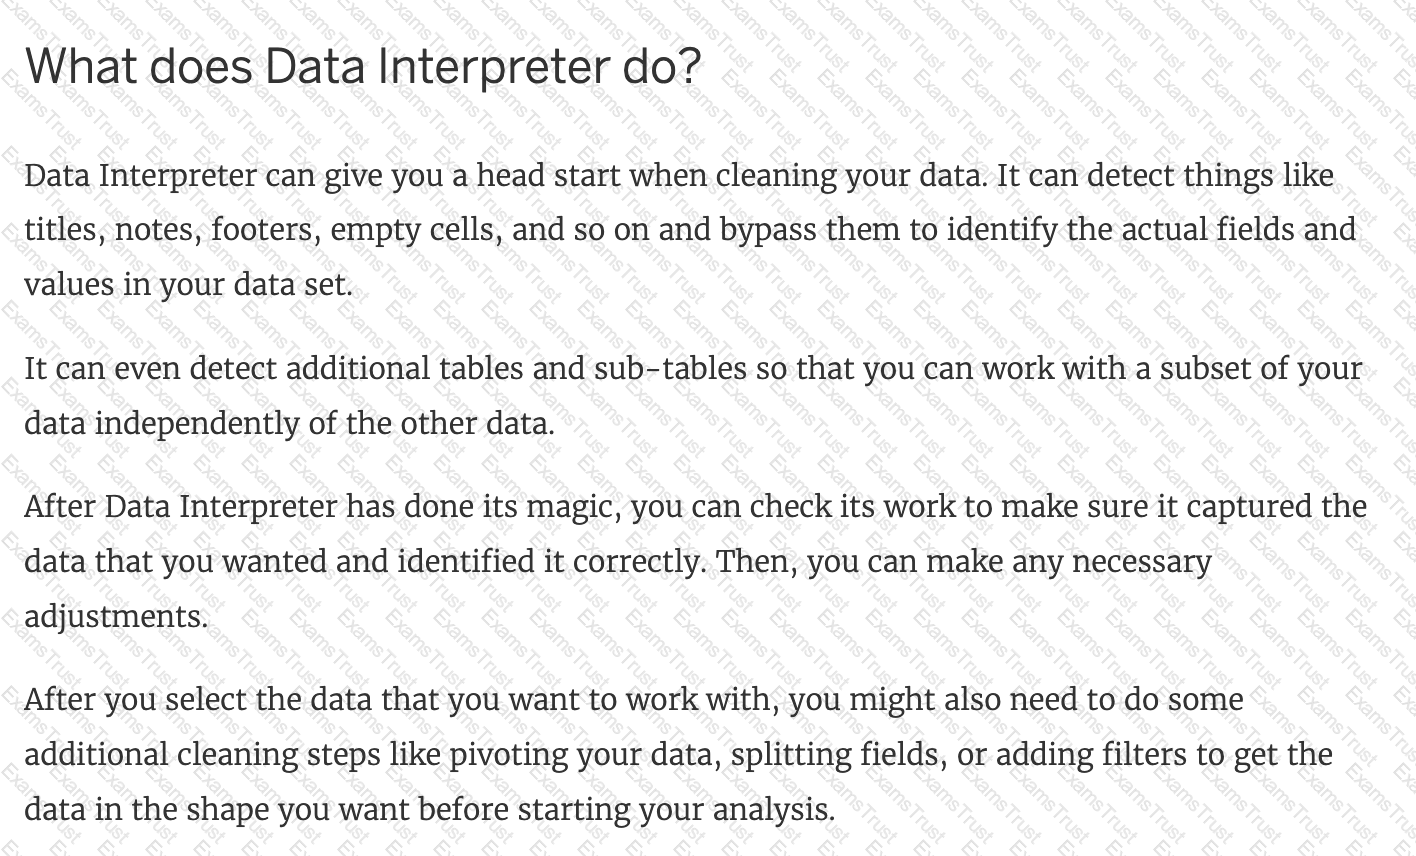
You can use the __________________ in Tableau to clean / organise your data.
Which of the following are True for Measure Names?
You can create _______________ for members in a dimension so that their labels appear differently in the view.
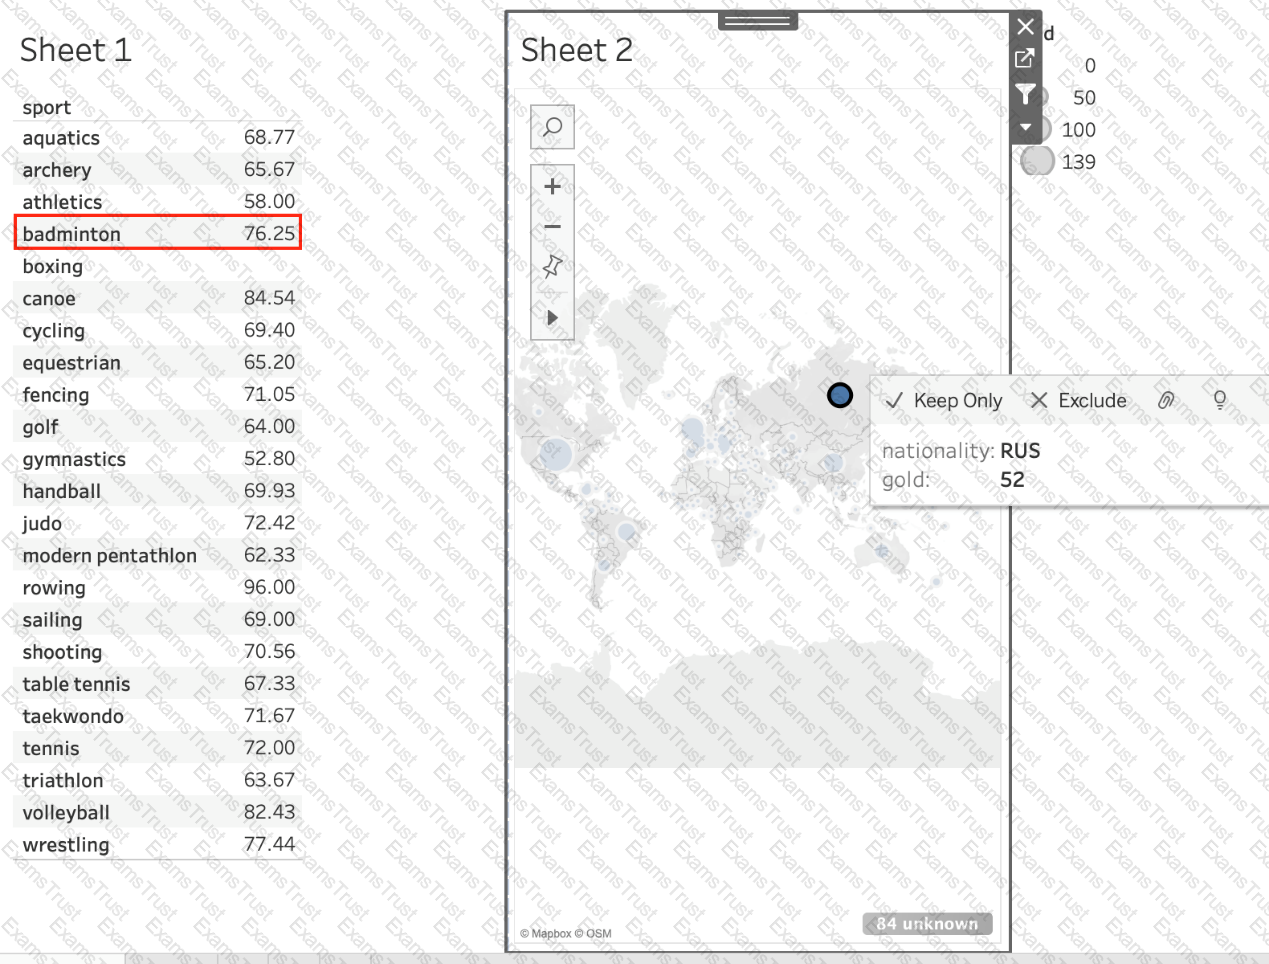
Using the atheletes table:
i) Create a sheet with a crosstab showing the Average weight for each sport (Sheet 1)
ii) Create a sheet with a Map showing the Total number of gold medals per Country. Use size as a Mark. (Sheet 2)
Now, Create a Dashboard containing both these sheets, and Use Sheet 2 as a Filter for Sheet 1. What was the average weight for Badminton in Russia?
(Ignore any nulls / unknowns)
Which of the following are valid ways to export a dashboard with multiple visualisations as an image?
Which two types of fields appear blue? Choose two.
To display data that has both negative and positive quantitative values, Tableau Desktop will display marks by using__________________as the default.
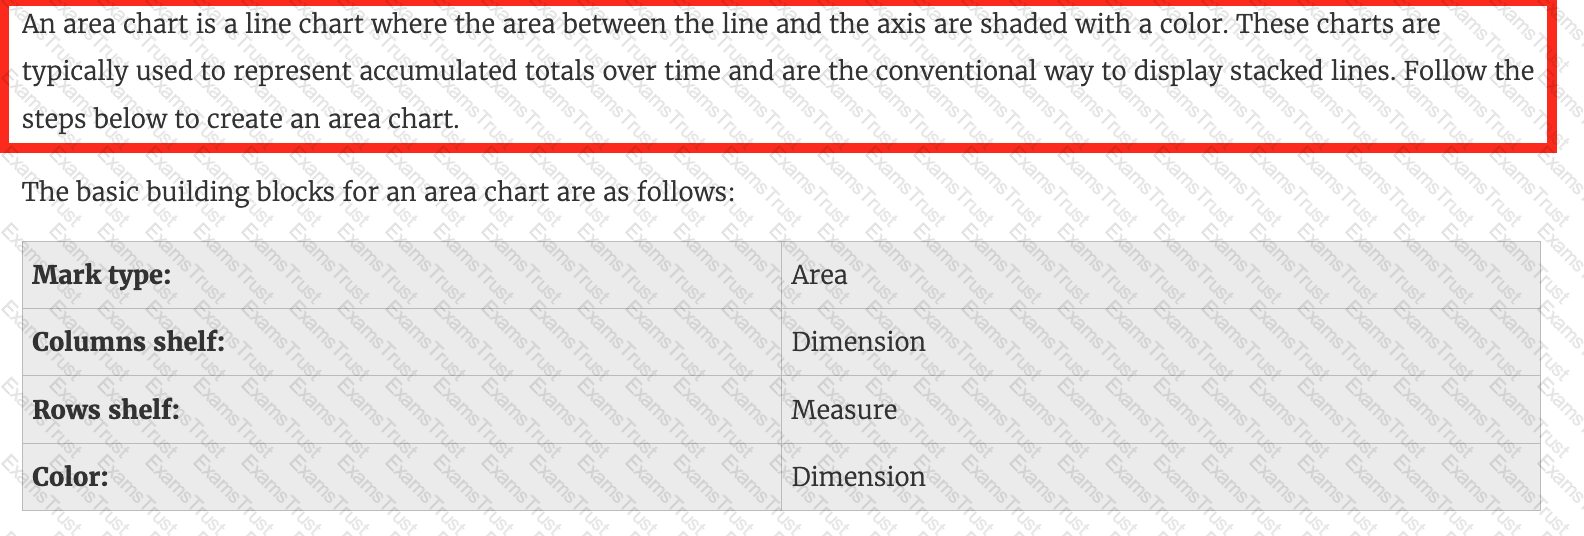
_____________ charts are typically used to represent accumulated totals over time and are the conventional way to display stacked lines.
What are three geographic roles that you can assign to a field? Choose three.
How can you add color to marks in the view in Tableau?
Which of the following fields would be best used as Dimensions?
Which of the following are benefits of using Data Extracts in Tableau?
What are two use cases for a story? Choose two.
When you drop a continuous field on Color, Tableau displays a quantitative legend with a ___________ range of colors.
Which two options can you use to change the device layout of a dashboard? Choose two.
Which of the following are valid ways to make the font more readable in Tableau?
Which two analytics options are available for a scatter plot view? Choose two.
DOWNLOAD THE DATASET FROM: (if you haven't already)
Using the cwurData table, plot a Map to see which country had the Second highest number of patents in the Year 2013?
A dual axis chart is useful for comparing two measures that___________.
How can you create a packaged data source?
Is it possible to deploy a URL action on a dashboard object to open a Web Page within a dashboard rather than opening the system’s web browser?
When using a data source that has relationships, how can you add a join between two or more tables?
What are two methods for renaming a field in a visualization? Choose two.
Which of the following are required to create a trend line?
With the Marks card drop-down menu set to Automatic, a line chart will be created whenever you place what on the Rows shelf and the Columns shelf?
You may create a context filter to:
Which of the following is a compelling reason to export a sheet in Tableau to a PDF?
Larger image
What is this entire view referred to as in Tableau?
Which of the following returns the Absolute Value of a given number?
As a general best practice, how many categories can a pie chart display effectively?
We can join a maximum of ______ tables in Tableau
You create a crosstab that shows a list of 100 hotel chains alongside their average nightly cost. You also create two groups showing, respectively, the top 10 and bottom 10 hotel chains by cost, with subtotals.
What should you do to improve the crosstab and compare the two groups to all the remaining hotel chains?
What are two examples of a date value?
Choose two.
By definition, Tableau displays measures over time as a ____________
When field names in the Union do not match, then:
True or False: LEFT JOIN returns all rows from the left table, with the matching rows in the right table
Which action describes the process for changing a measure so that it automatically aggregates an average instead of a sum?
Using the CoffeeChain table, create a Dual Axis chart showing the Sales (Bar chart) and Profit (Line Chart) for each Product type. What was the Profit for the Herbal Tea product type in 2013?
Which of the following options best describe measures?
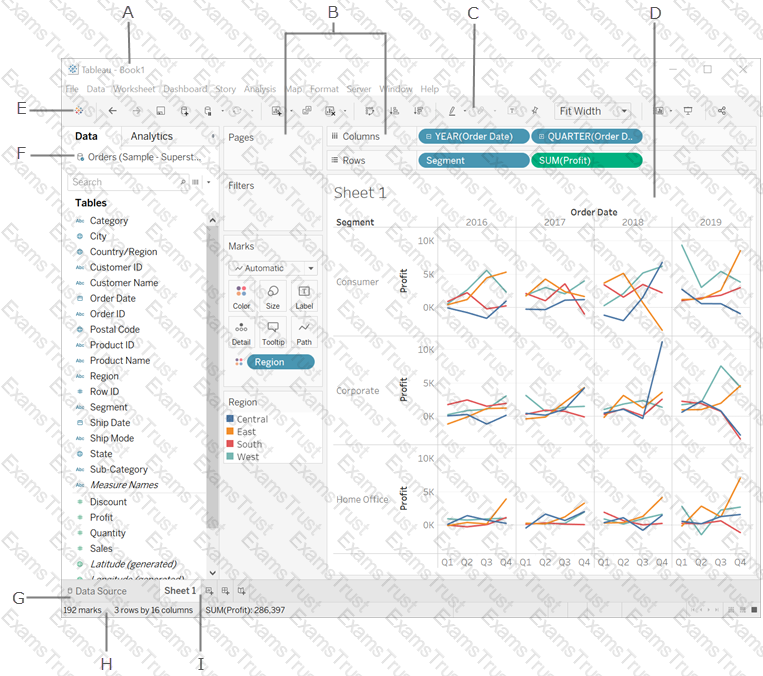
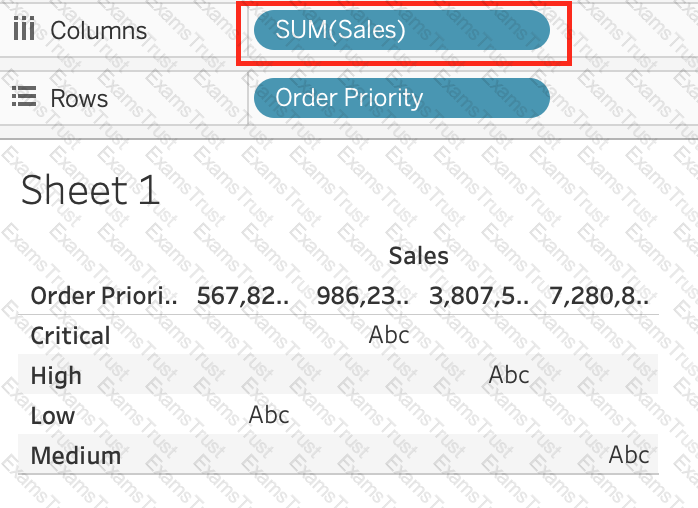
You clicked Sheet 1 from the data source page, and now you have opened the Tableau Desktop workspace as shown above. What is the main thing that you do here?
Which of the following sets would you use to compare the members?
What will the following function return?
LEFT("Tableau", 3)
You have a workbook that contains one data source and you need to combine data from another database. What should you do first?
What are two outcomes when you drag a continuous date value to the Rows shelf? Choose two,
Which of these is NOT a type of Quick Filter available in Tableau?
Which of the following is a good reason for using a bullet graph?
You want to add Custom shapes to your visualisation. Where can you add these new shapes?
True or False: All rows from both tables are returned in an INNER JOIN
Which three elements are included in a packaged workbook (.twbx)? Choose three.
________________ can only create header. _______________ will create header and axis both.
Which two functionalities can you provide to consumers by adding a parameter to a visualization? Choose two.
Which of the following are valid options to define the scope of a reference line? Choose 3.
You need to uniformly change the size for all marks in a view.
What should you do?
The option to create bins is available for which type of field?
Dates in Tableau are typically treated as ______________
Is it possible to make a Measure discrete?
You have a data set that builds a union between two tables. You need to extract the data set. What should you use to extract the data set?
Which statement accurately describes an extract when the Physical Tables option is selected?
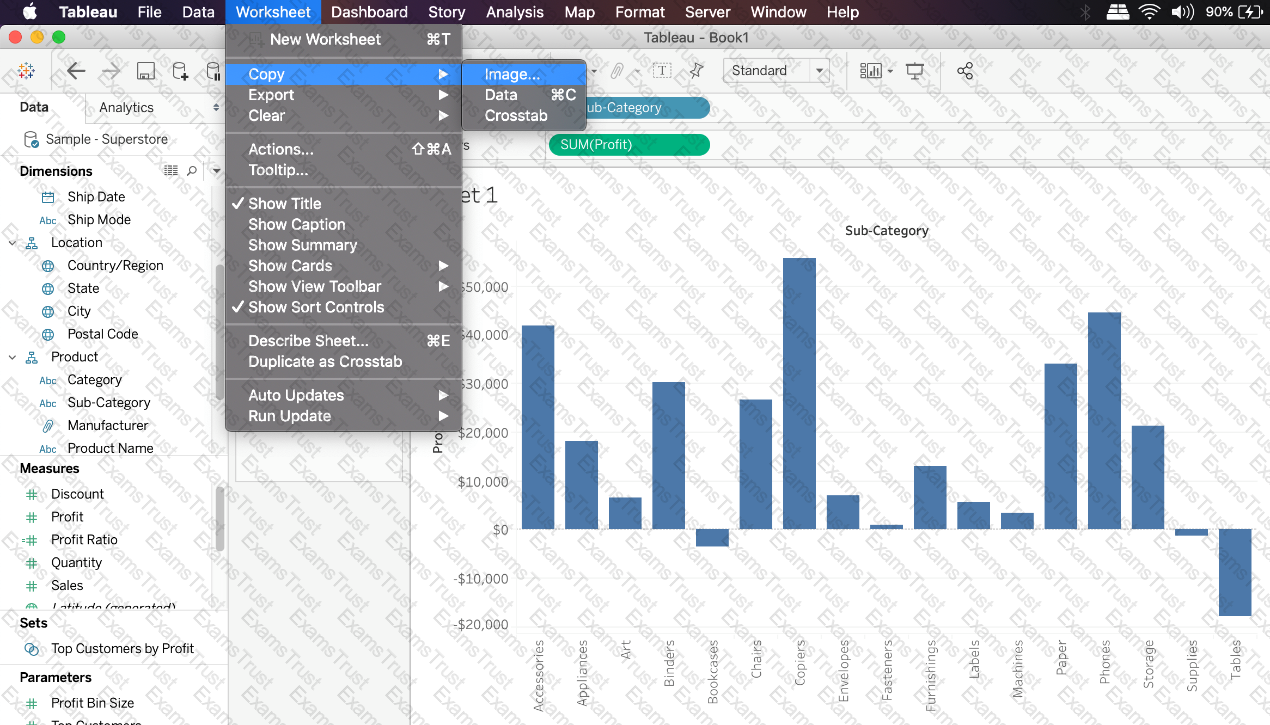
Which of the following are valid ways to copy a worksheet visualisation as an image?
What two methods can you use to change the font of a worksheet title? Choose two.
In which of the following scenarios would having a live connection be more beneficial than using an extract?
Which of the following are correct ways to define a join in Tableau version 2020.3 and above?
What allows you to drill up or down in the level of detail (LOD)?
Which of the following calculations DO NOT need a quick table calculation?
________________ files are shortcuts for quickly connecting to the original data that you use often. Data source files do not contain the actual data but rather the information necessary to connect to the actual data as well as any modifications you've made on top of the actual data such as changing default properties, creating calculated fields, adding groups, and so on.
Are animations enabled by default in Tableau?
Which two filter modes can you use with dimension filters? Choose two
Which of the following lets you group related dashboard items together so you can quickly position them?
The default path for all supporting files, data sources, icons, logs etc is in ______________________
How can you change the Default Aggregation for a measure in Tableau?
Skipped Join the Geo Data and Time Series Table on the Item Number ID column, and display the Store count for every State on a Map. What was the Store count in 2017 for Texas (TX)?
Join the Geo Data and Time Series Table on the Item Number ID column, and display the Store count for every State on a Map. What was the Store count in 2017 for Texas (TX)?
How can you change the default Tableau repository location?
If you are working with a huge dataset, which of the following are strong reasons to use a context filter?
You have the following visualization.
You need to show how Internet Usage values change from year-to-year as a percentage. Which quick table calculation should you apply to the Internet Usage field?
Which of the following are true about dimensions?
Question 45: Skipped
You have just created a histogram and now want to be able to change the size of bins dynamically. Using which of the following will easily satisfy your requirement?
________________ is hosted by Tableau to share our visualisations publically with the world.
What statement correctly describes a requirement to create a reference line in Tableau?
True or False: When relating tables, the fields that define the relationships must have the same data type.
Which of the following is a discrete date part?
Which of the following are valid Layout Container types when using Dashboards in Tableau?
When using a Blend, what is the color of tick-mark on the primary and secondary data sources respectively?
You have cleaned a data source properly, created some calculated fields and renamed some columns. You want to save these changes for future use cases. Which of the following would BEST satisfy this requirement?
Using the cwurData table, create a cross-tab showing the number of Publications per Country broken down by Institution, and filtered by Country to only show United Kingdown (UK). For the University of Manchester, what percent of the total publications were contributed in 2014?
What does the following marker/icon do in Tableau?
Using the Time Series table, create a cross-tab showing sales for each Assortment broken down by Year and Quarter. In Q4 of October 2017, what was the Average sales amount for the Hardware assortment?
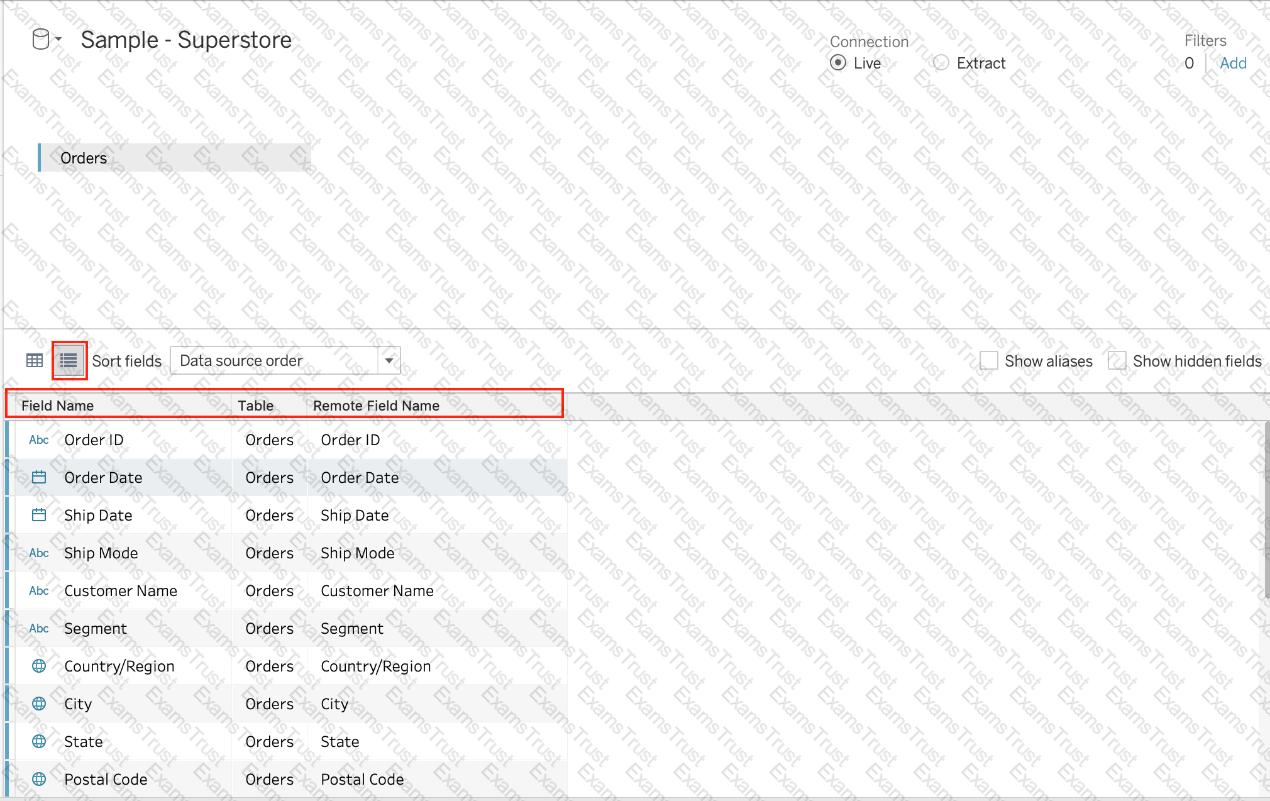
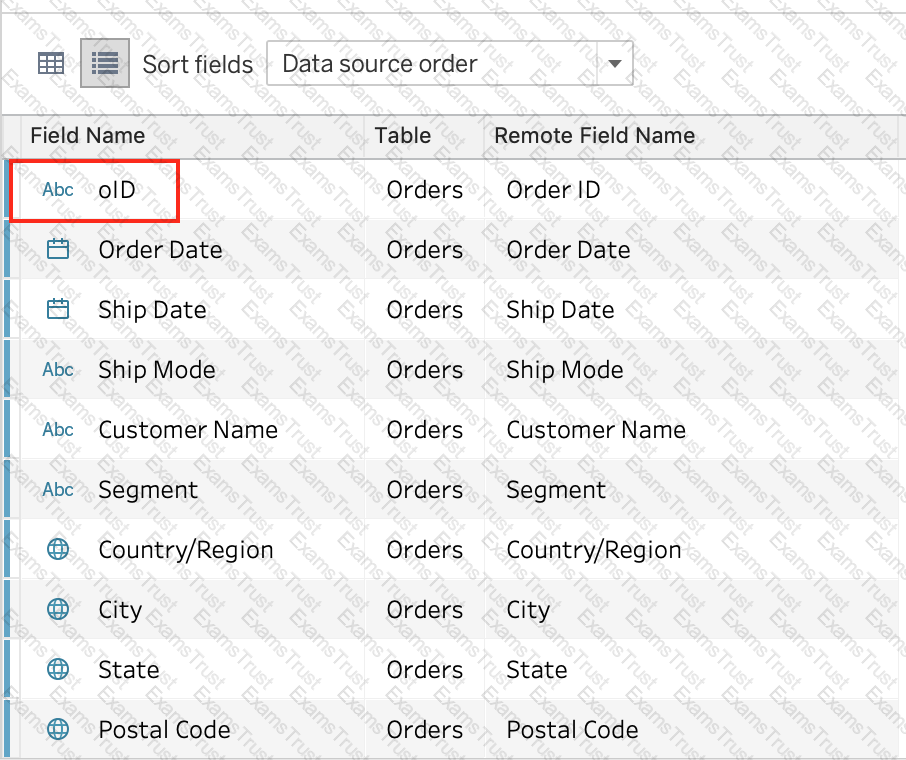
When using the manage metadata option, we can create custom names for columns where _____________ is the original name of the column whereas _____________ is the custom name we created in Tableau.
What should you use to create headers in a visualization?
Which of the following URL prefixes are permitted when creating a URL Action in Tableau?
Which of the following is a valid way to create Sets in Tableau?
 Table
Description automatically generated
Table
Description automatically generated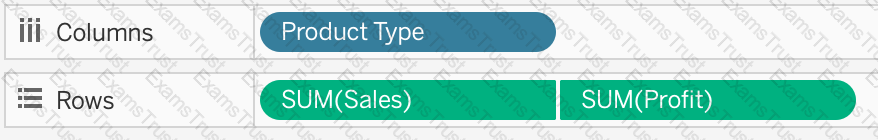
 Graphical user interface, application
Description automatically generated
Graphical user interface, application
Description automatically generated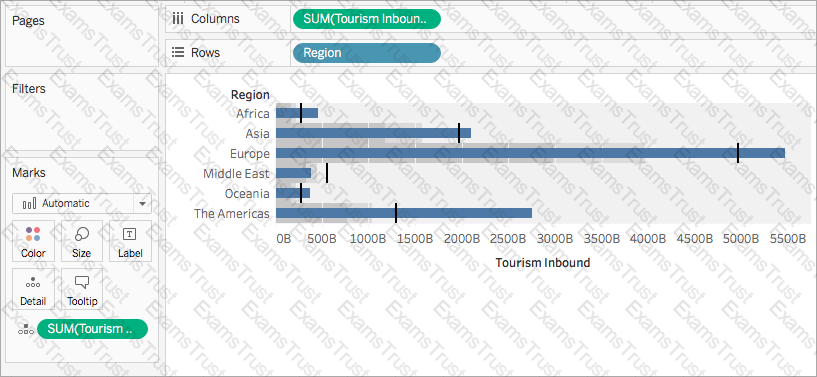
 Chart, bar chart
Description automatically generated
Chart, bar chart
Description automatically generated