Relationships are represented by __________________ and operate at the ____________________.
Which of the following are valid reasons to use a Tableau Data Extract (.tde) over Live Connections?
You have a dashboard that shows car rental statistics by city, including a field named Car Dropoff City in the view. A URL action in the dashboard uses
When you click Salt Lake City in the view, to where will the URL action direct you?
A dual axis chart is useful for comparing two measures that___________.
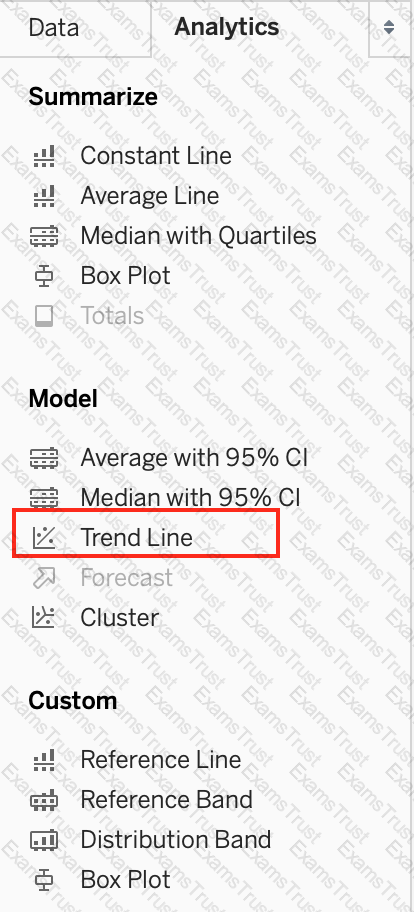
Which two analytics options are available for a scatter plot view? Choose two.
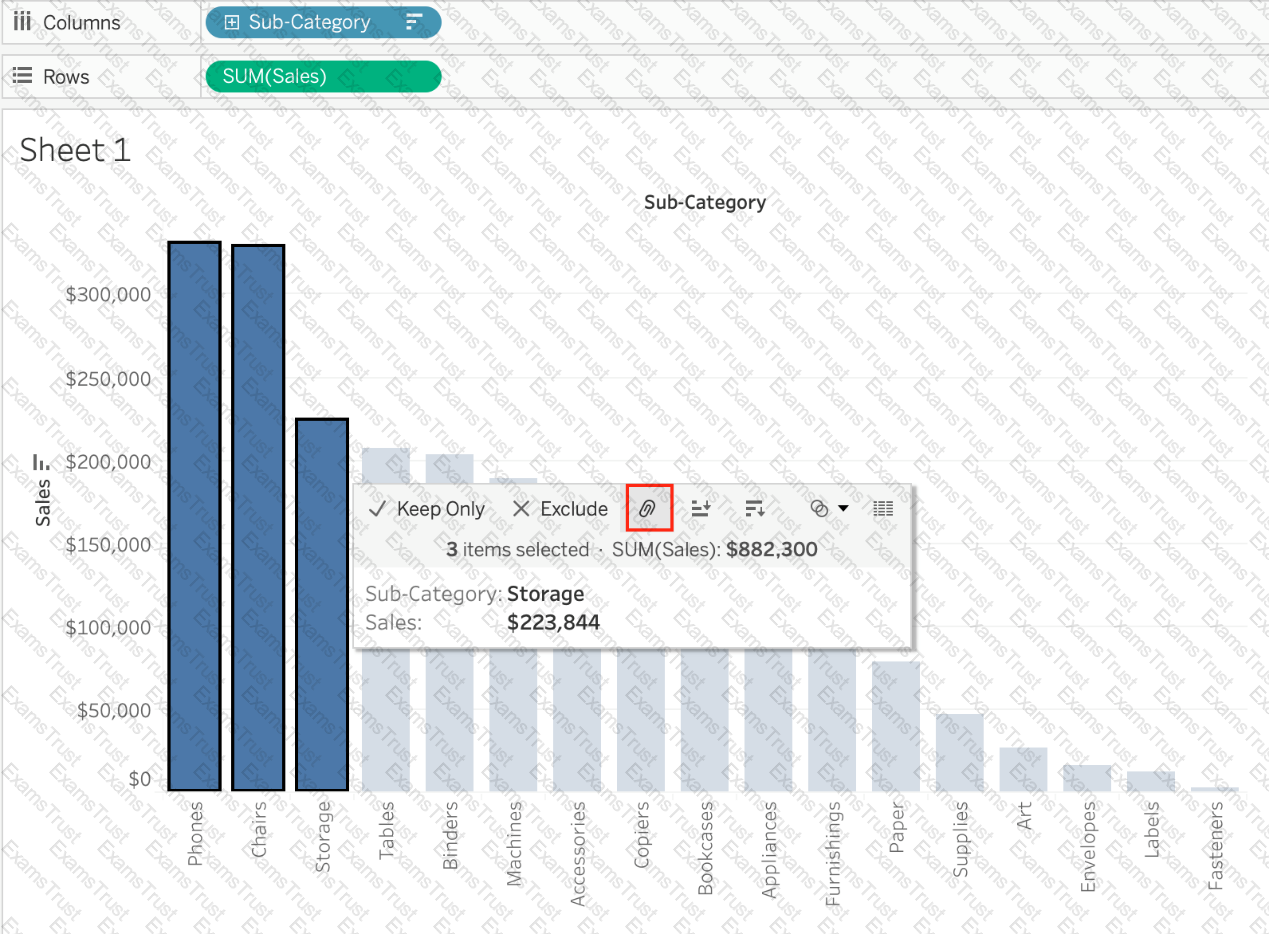
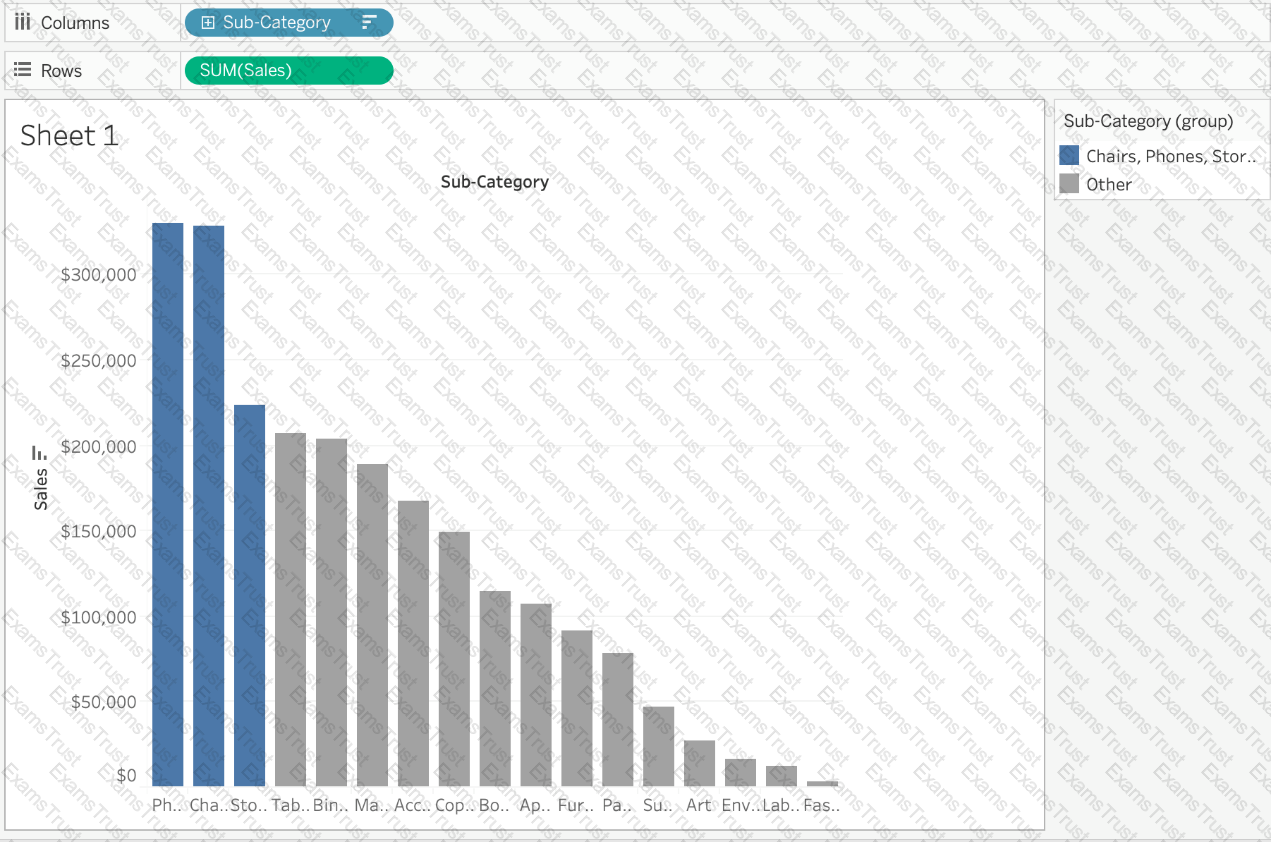
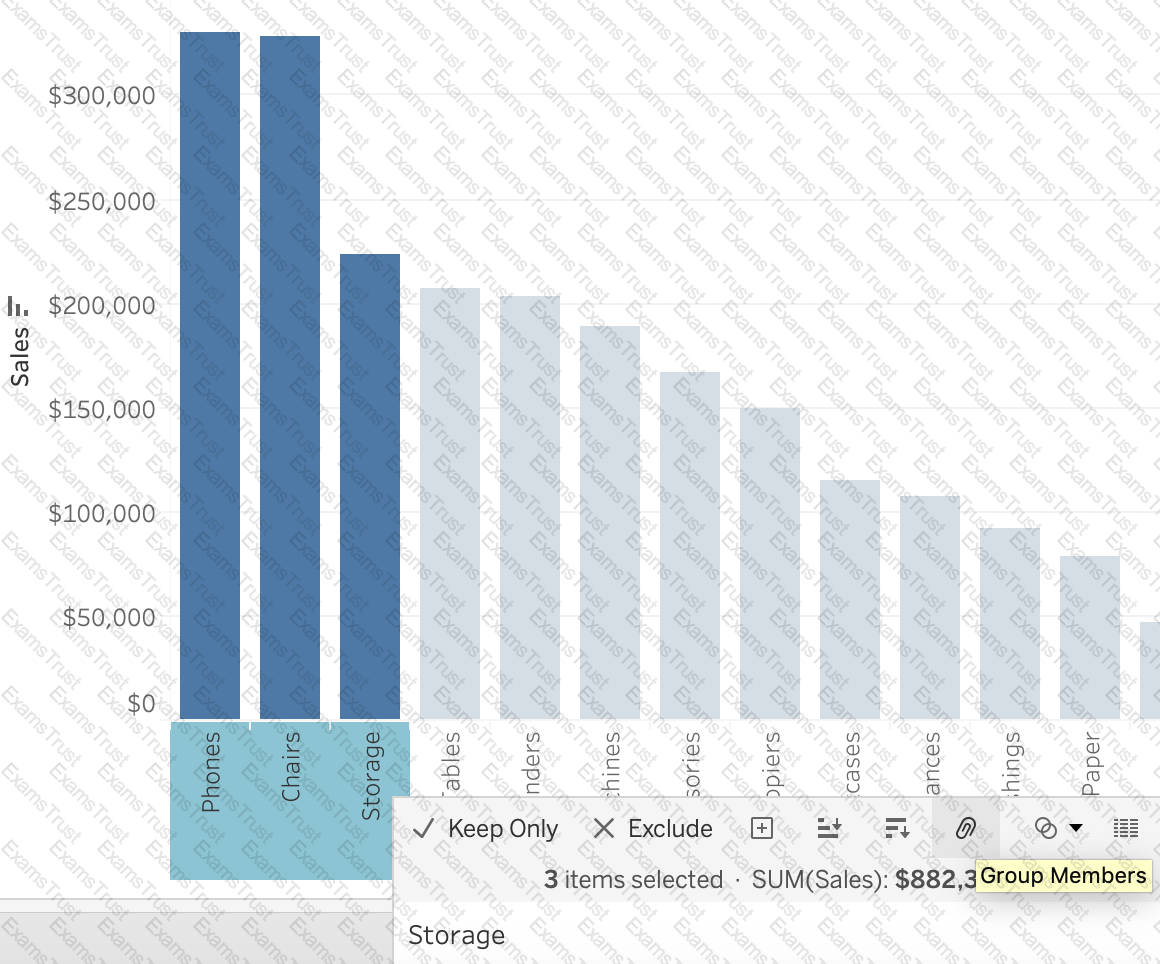
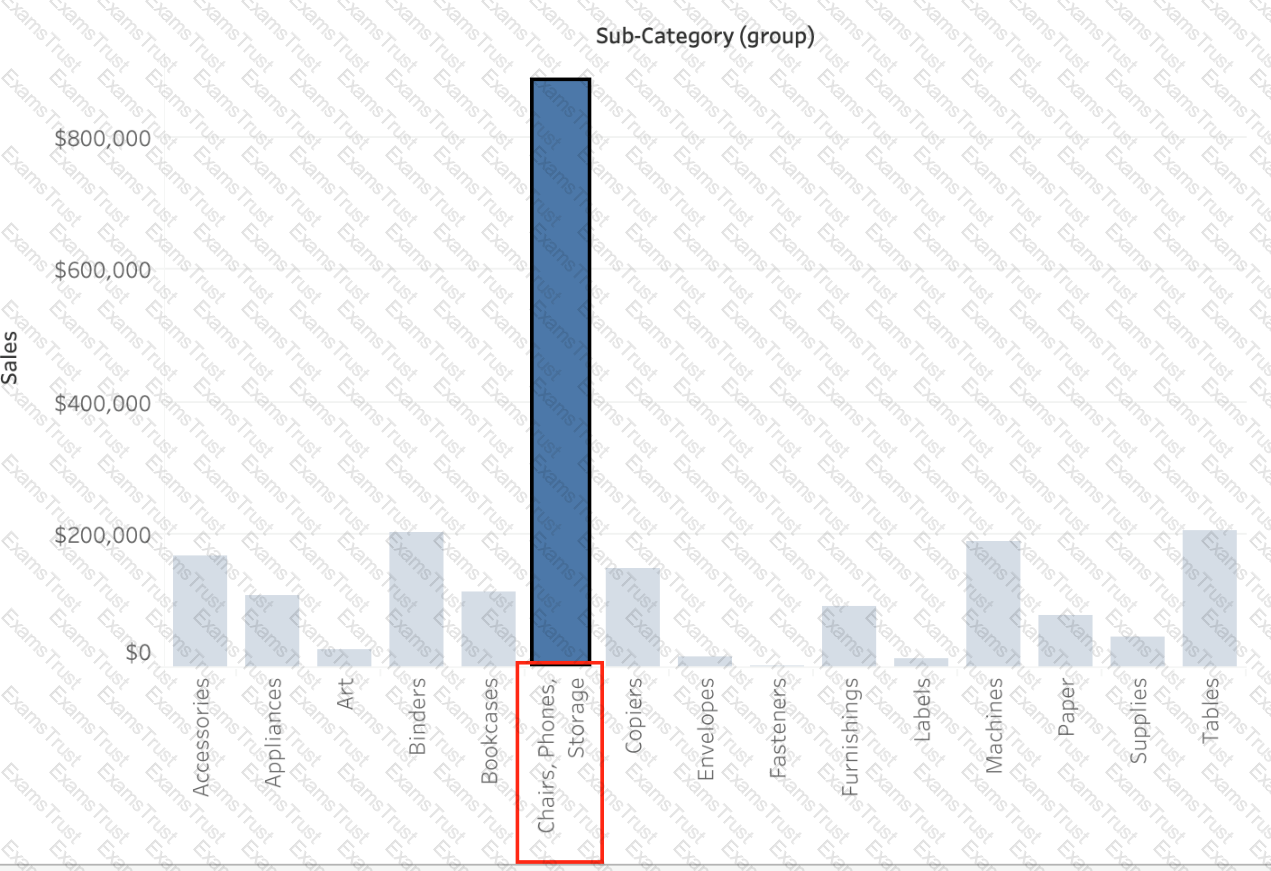
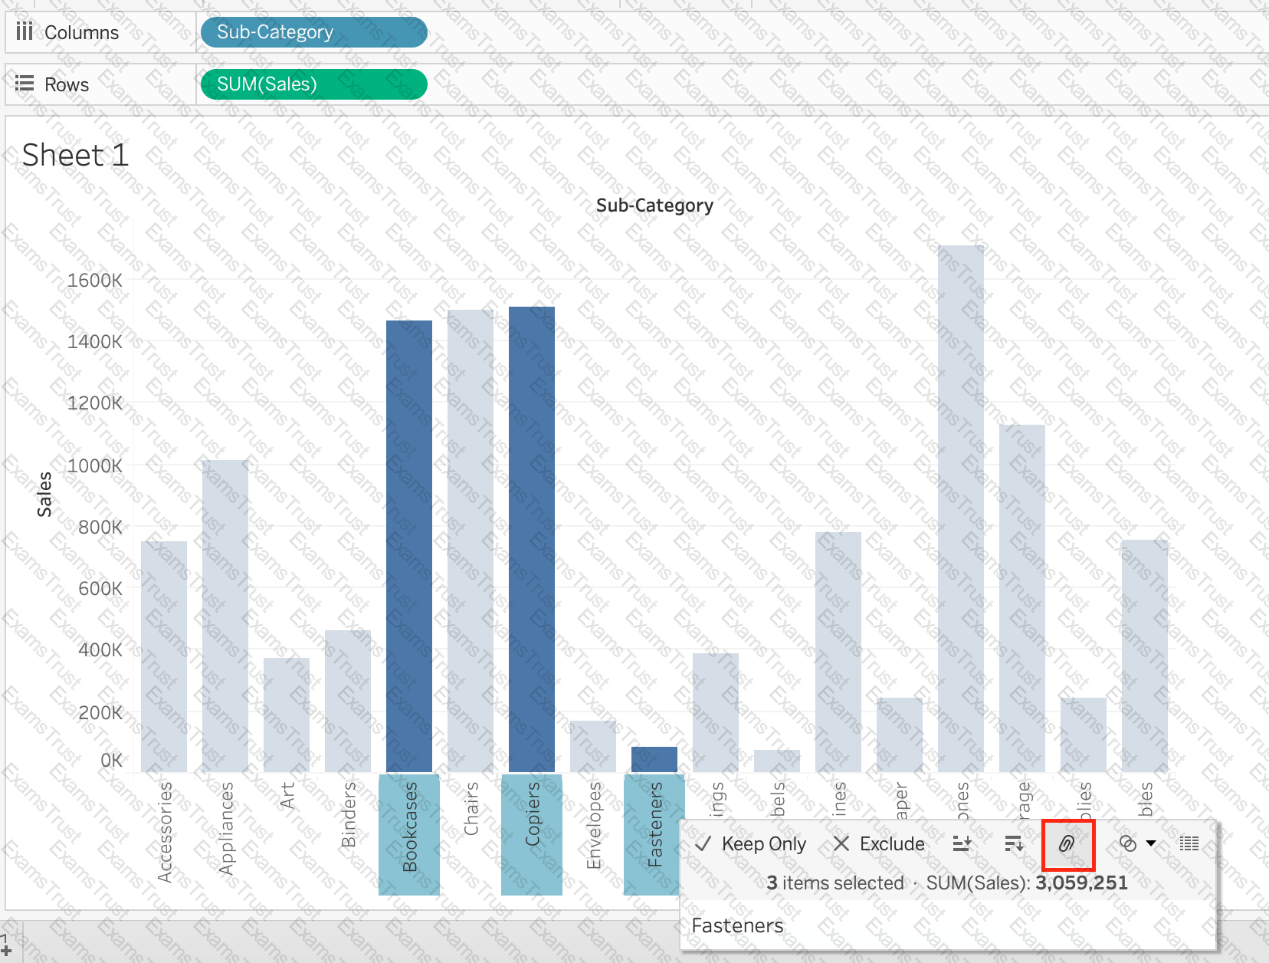
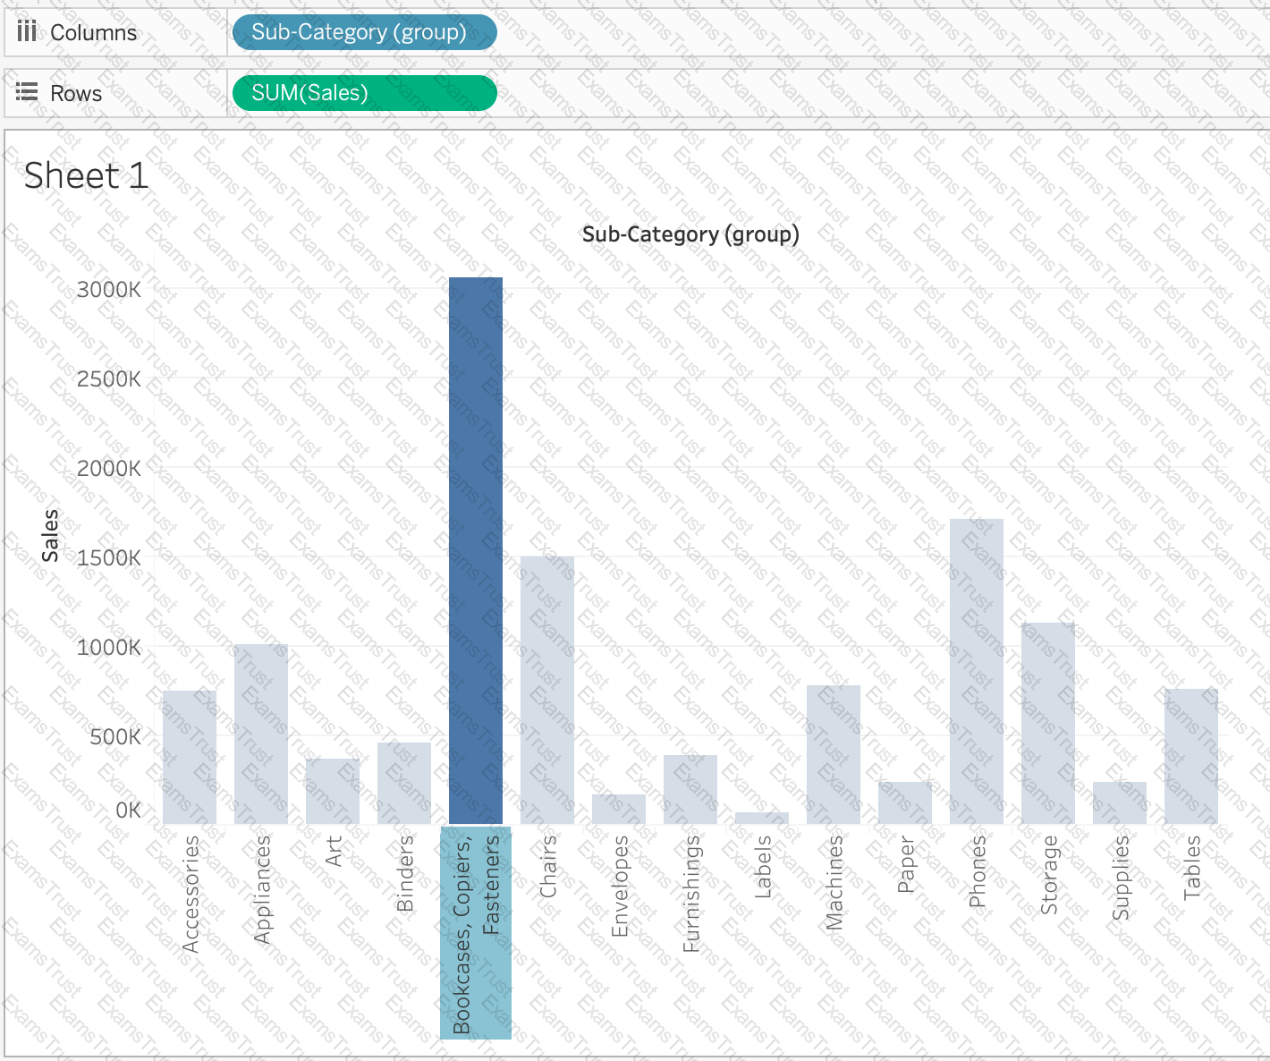
Suppose you have a bar chart. When we group by labels in a view, which of the following happens?
Which of the following are stored in a .tds file? Choose 3.
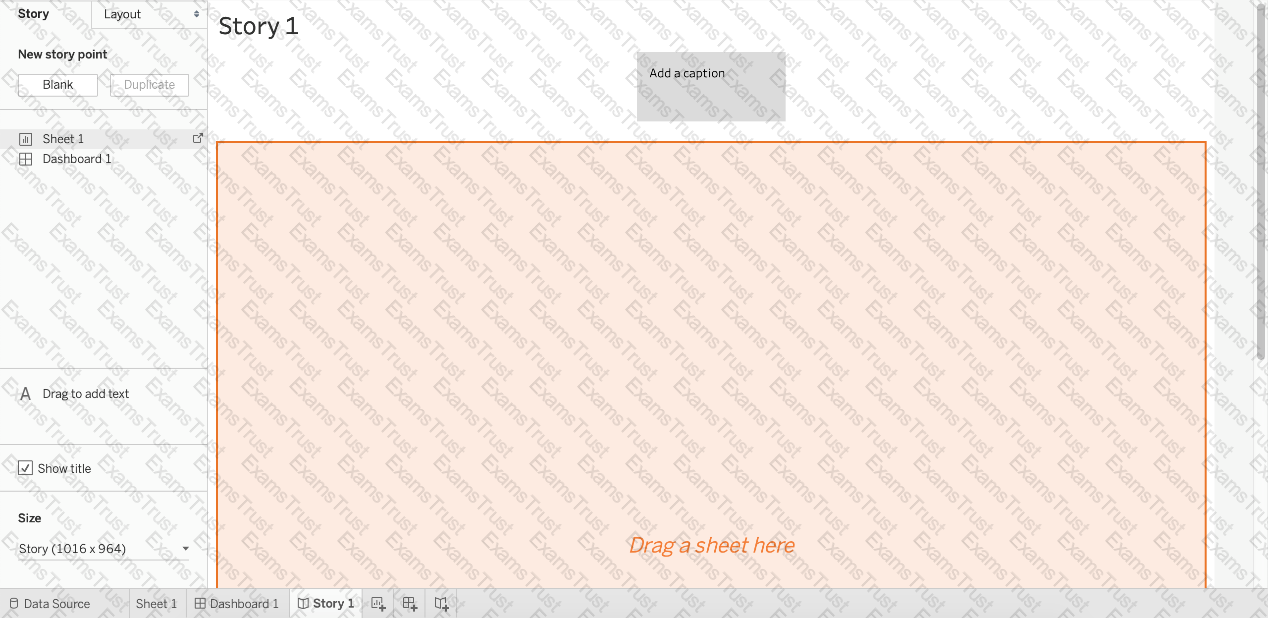
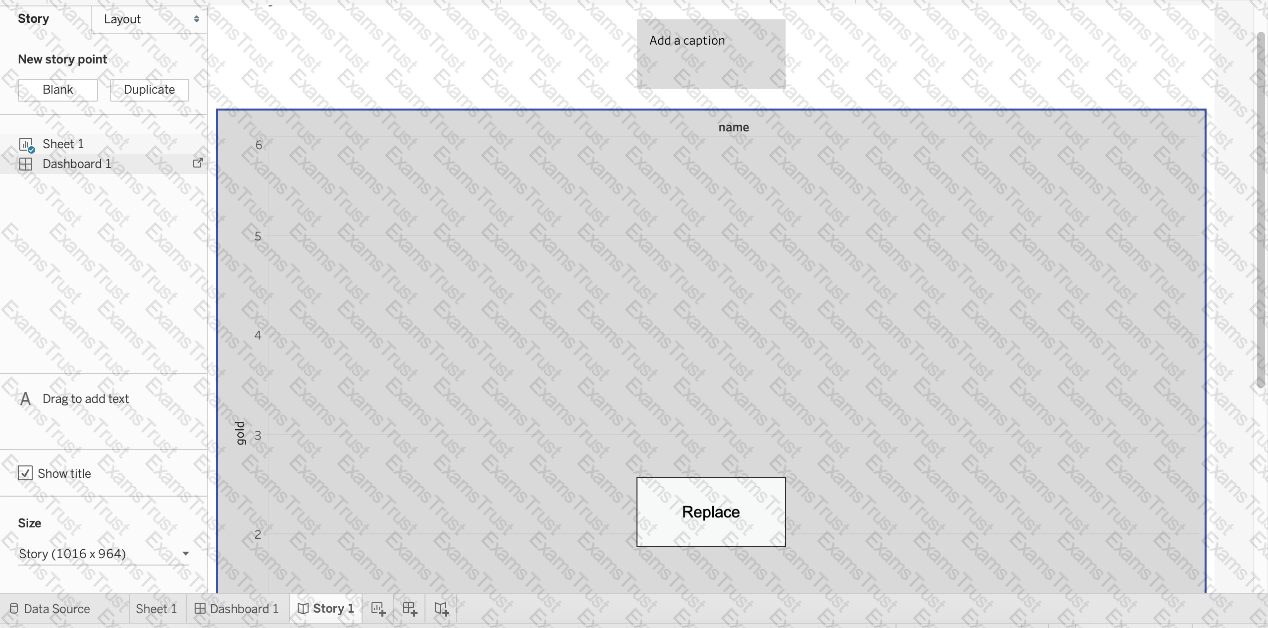
What is a story point in Tableau?
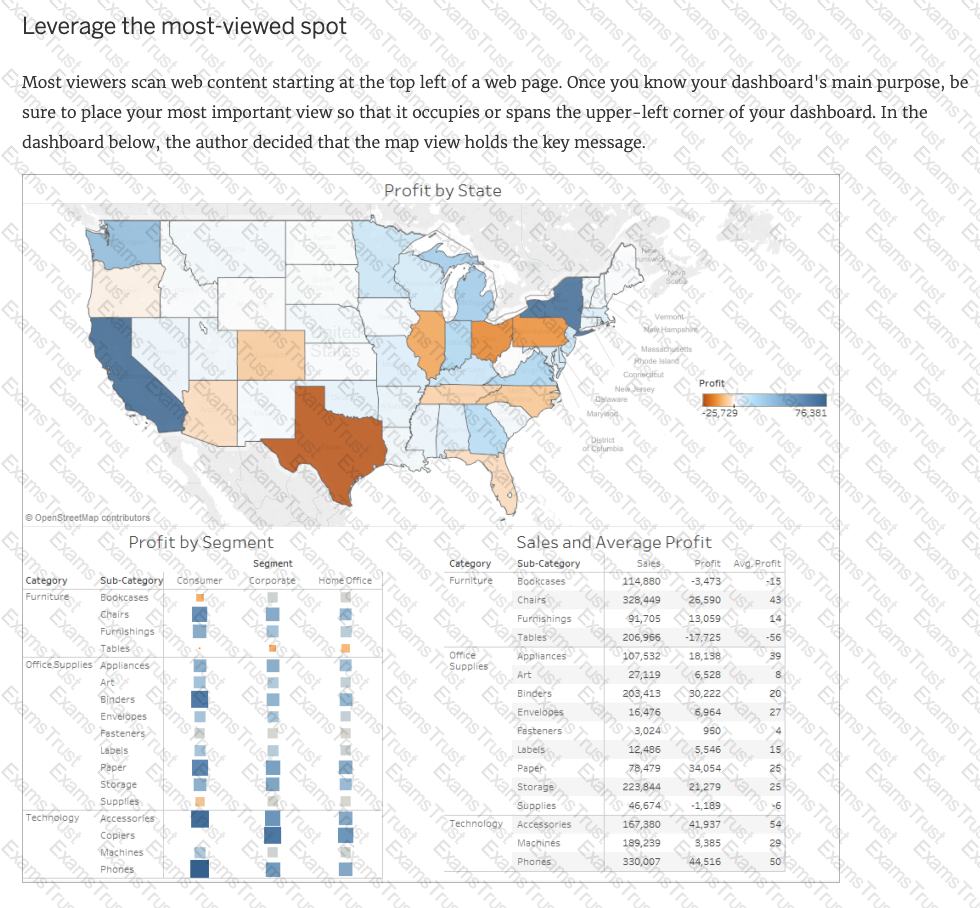
Most viewers scan content starting at the _____________ of a page.
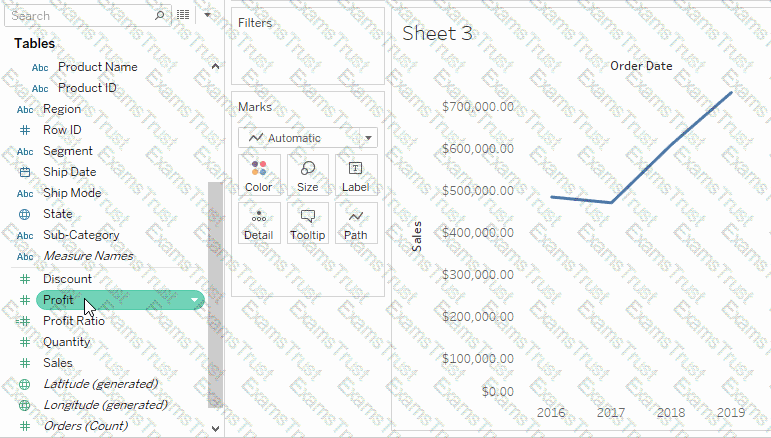
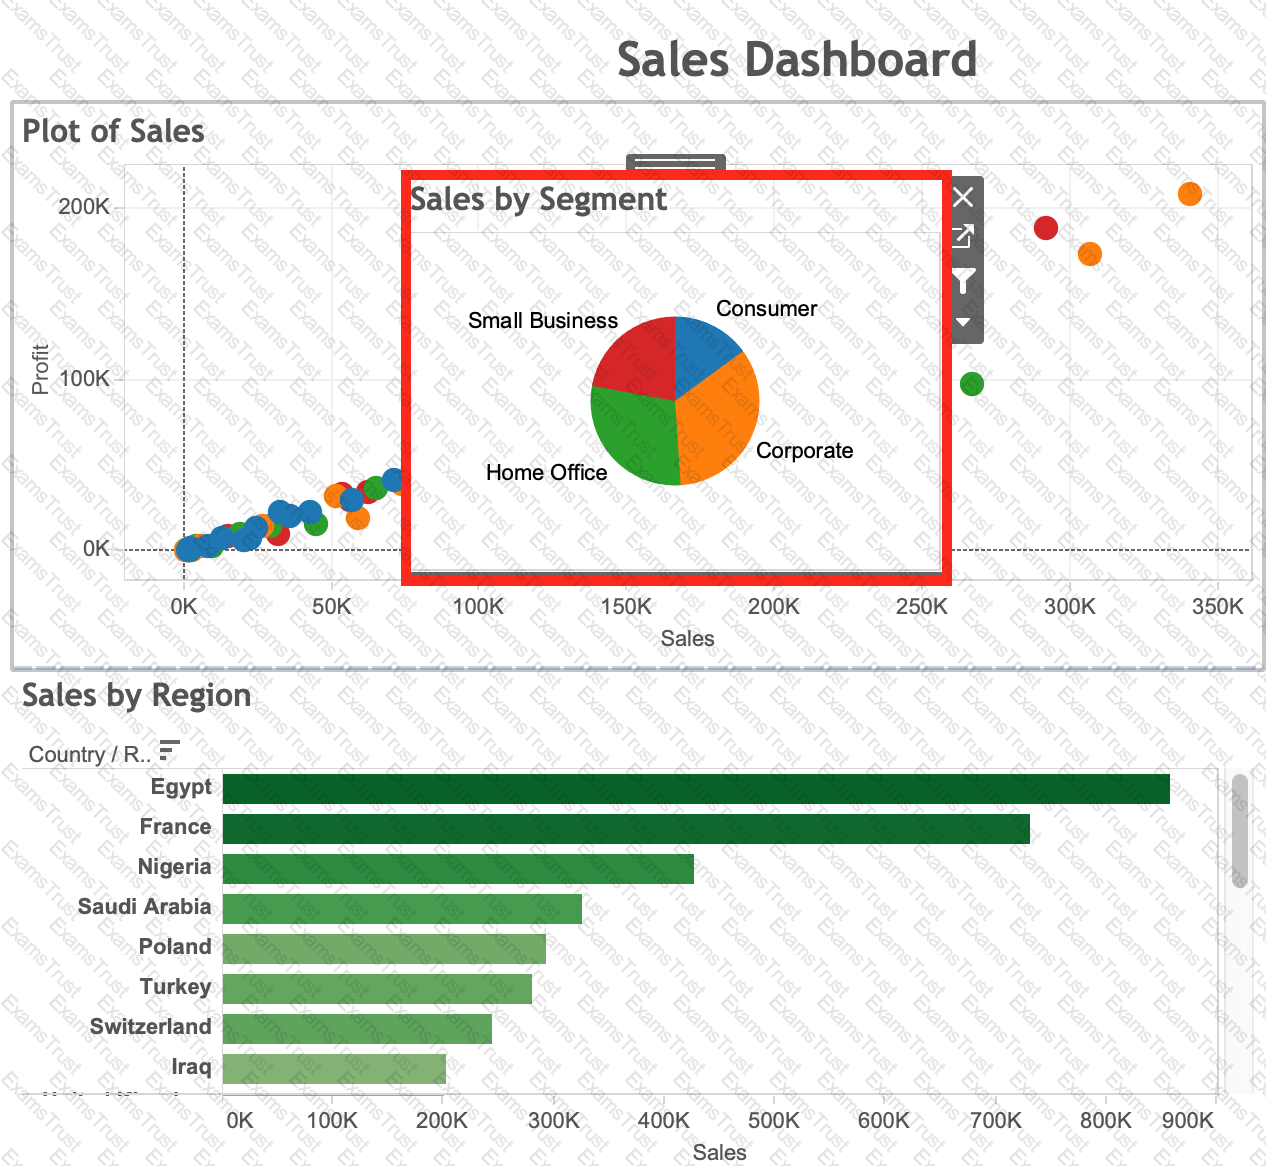
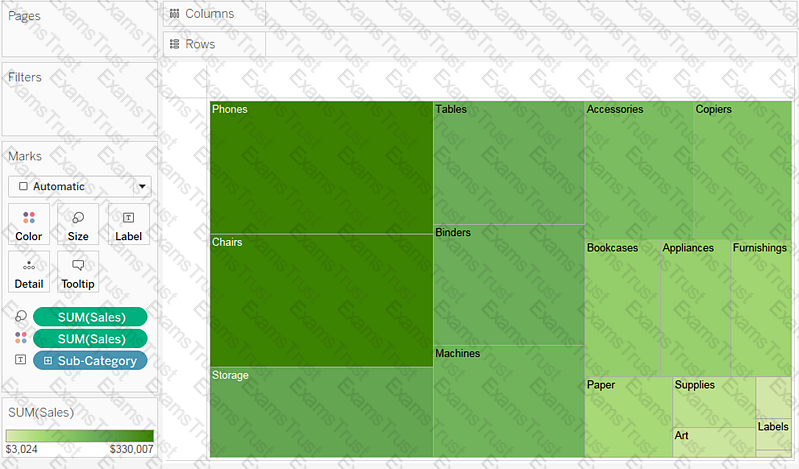
You have the following visualization.
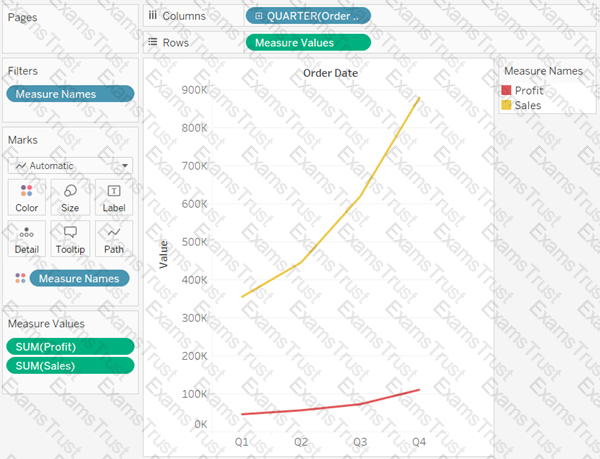
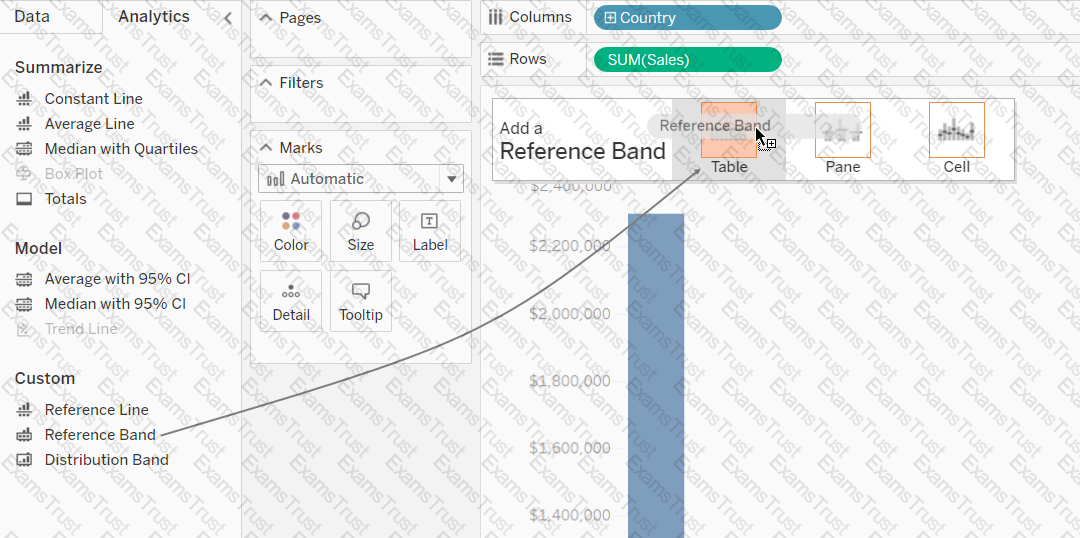
Where should you place a field named Region to show multiple distinct lines on the same axis?
Which of the following are valid ways to trigger actions for a Dashboard?
What are two benefits of using a live connection to a data source as compared to an extract? Choose two.
Which three statements accurately describes the capabilities of dashboard actions? Choose three.
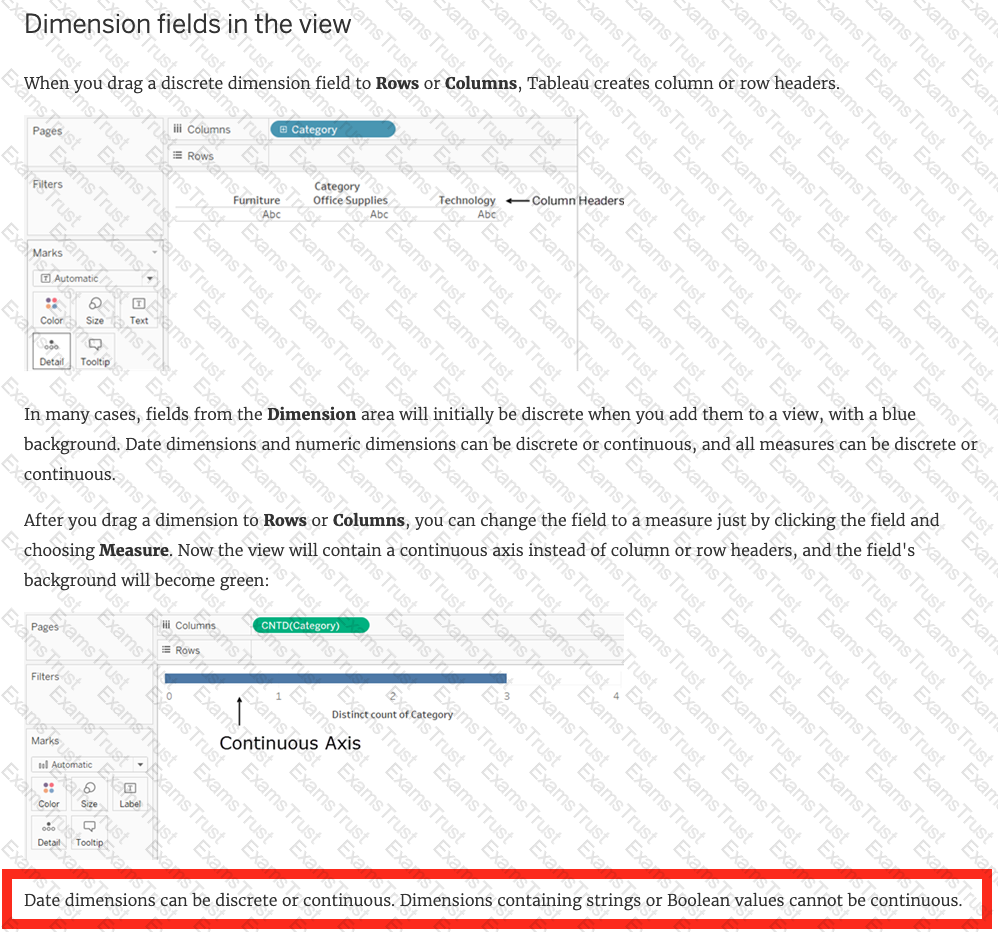
Dimensions containing ____________ and ____________ values cannot be continuous.
Which two elements can have their values changed by using a dashboard action? Choose two.
Which of the following options best describe measures?
True or False: It is not possible to blend axes for multiple measures into a single axis
Creating a scatter plot requires a minimum of how many measures?
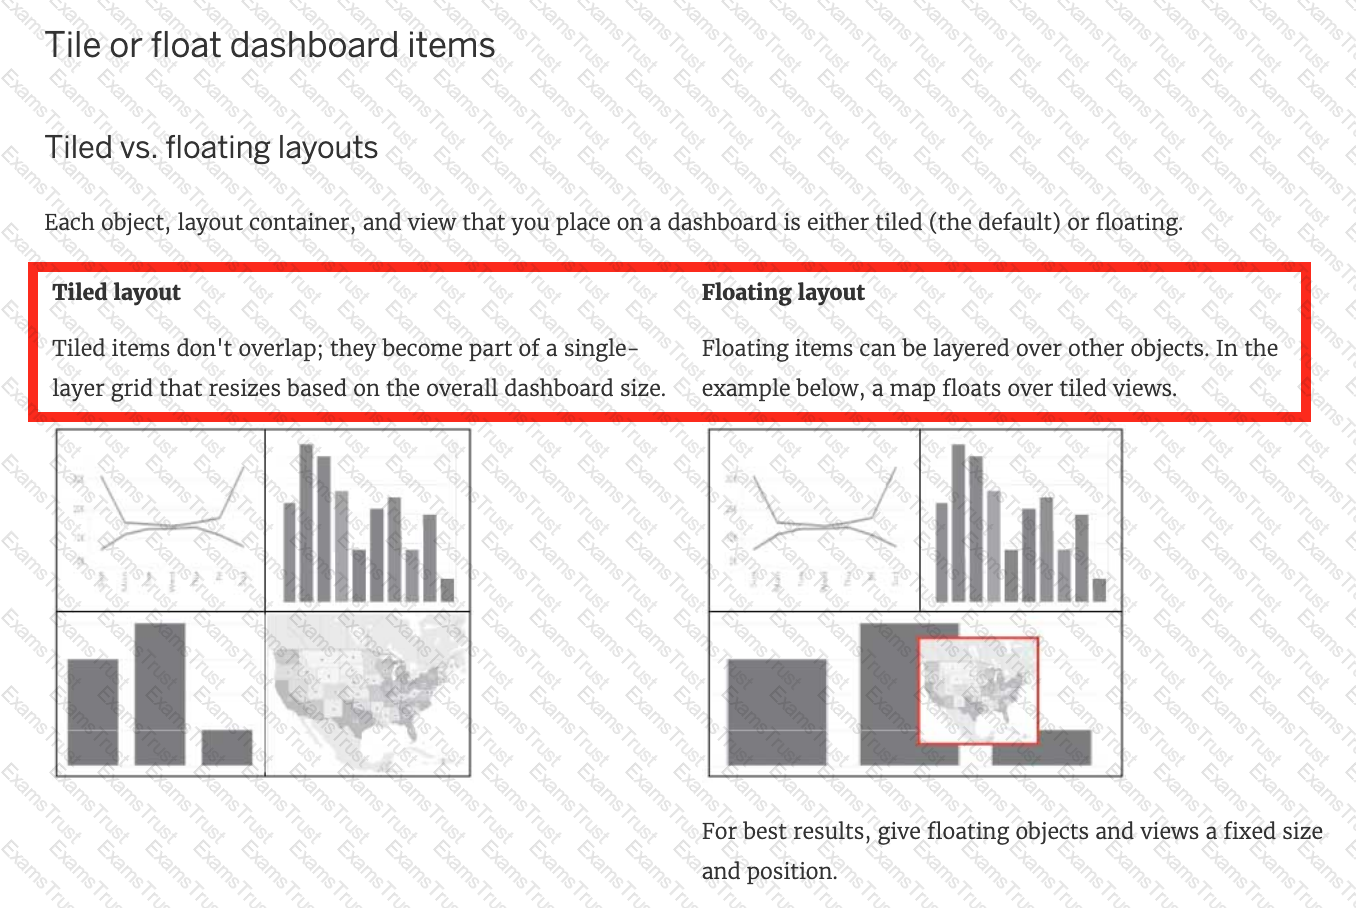
Which of the following lets you group related dashboard items together so you can quickly position them?
When you connect to a new data source, all worksheets that previously referred to the original data source now refer to the new data source. If the new data source does not have the same field names as the original workbook, the fields are marked with an exclamation point

. Which feature helps us fix this issue?
True or False: Sets can be created on Measures
The calculation [Ship Date] - [Order Date] will return _______________
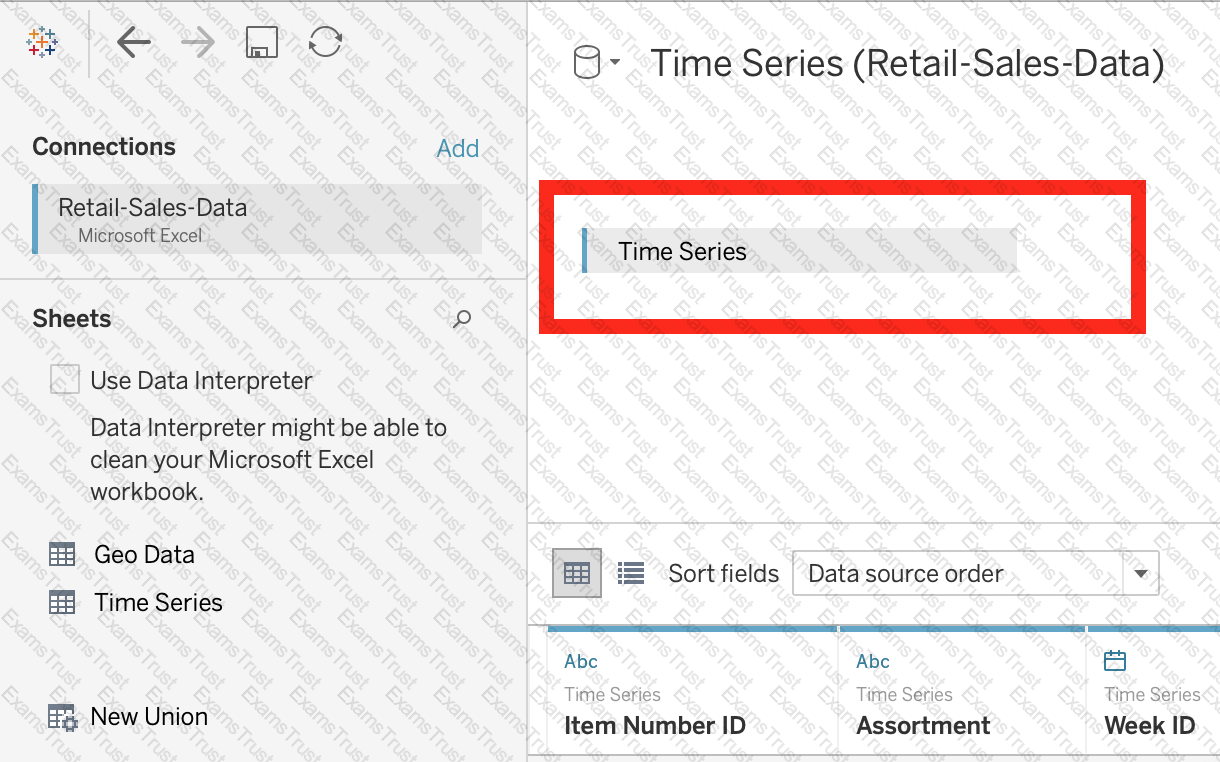
DOWNLOAD THE DATASET FROM: (if you haven't already)
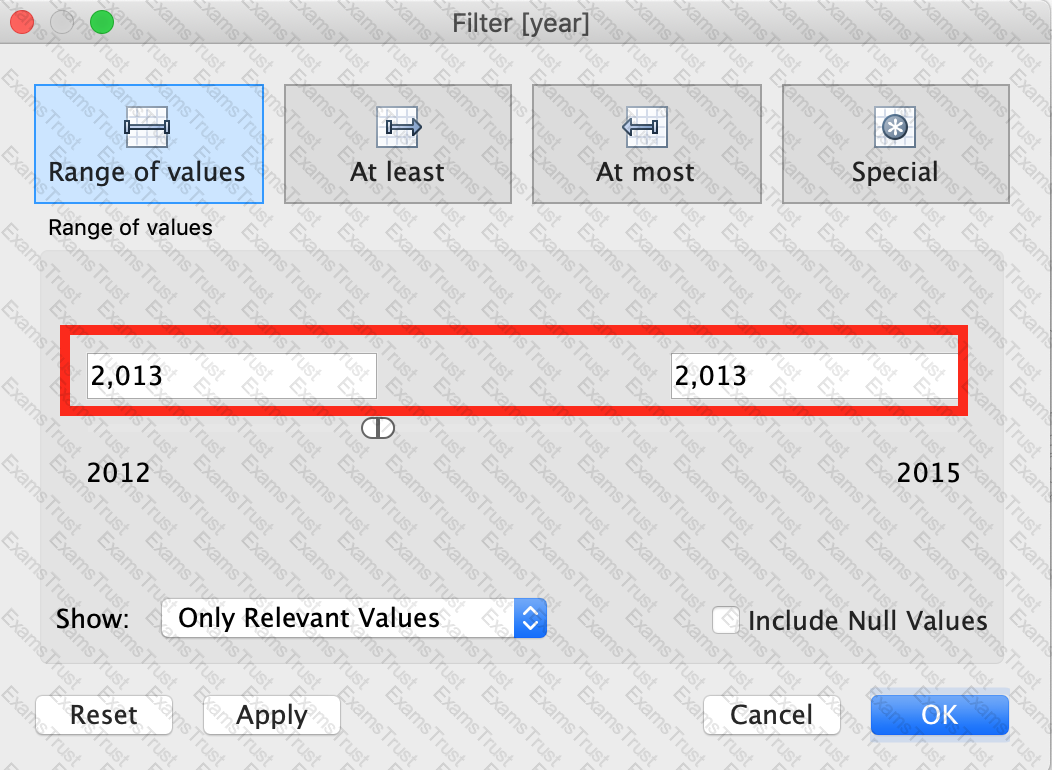
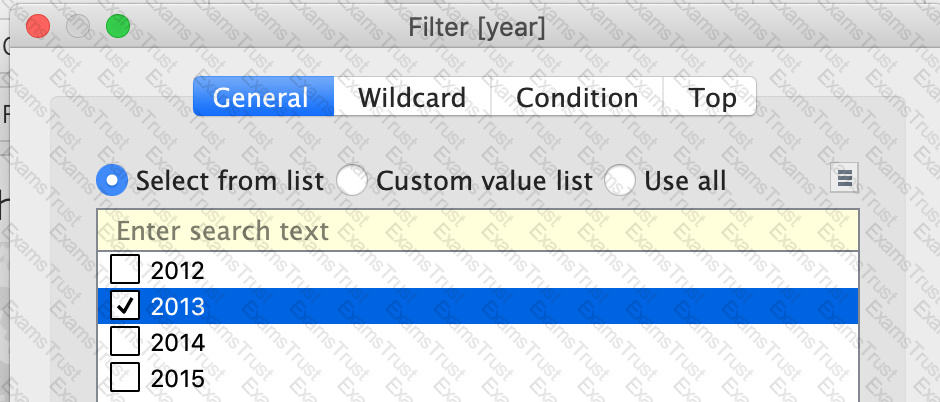
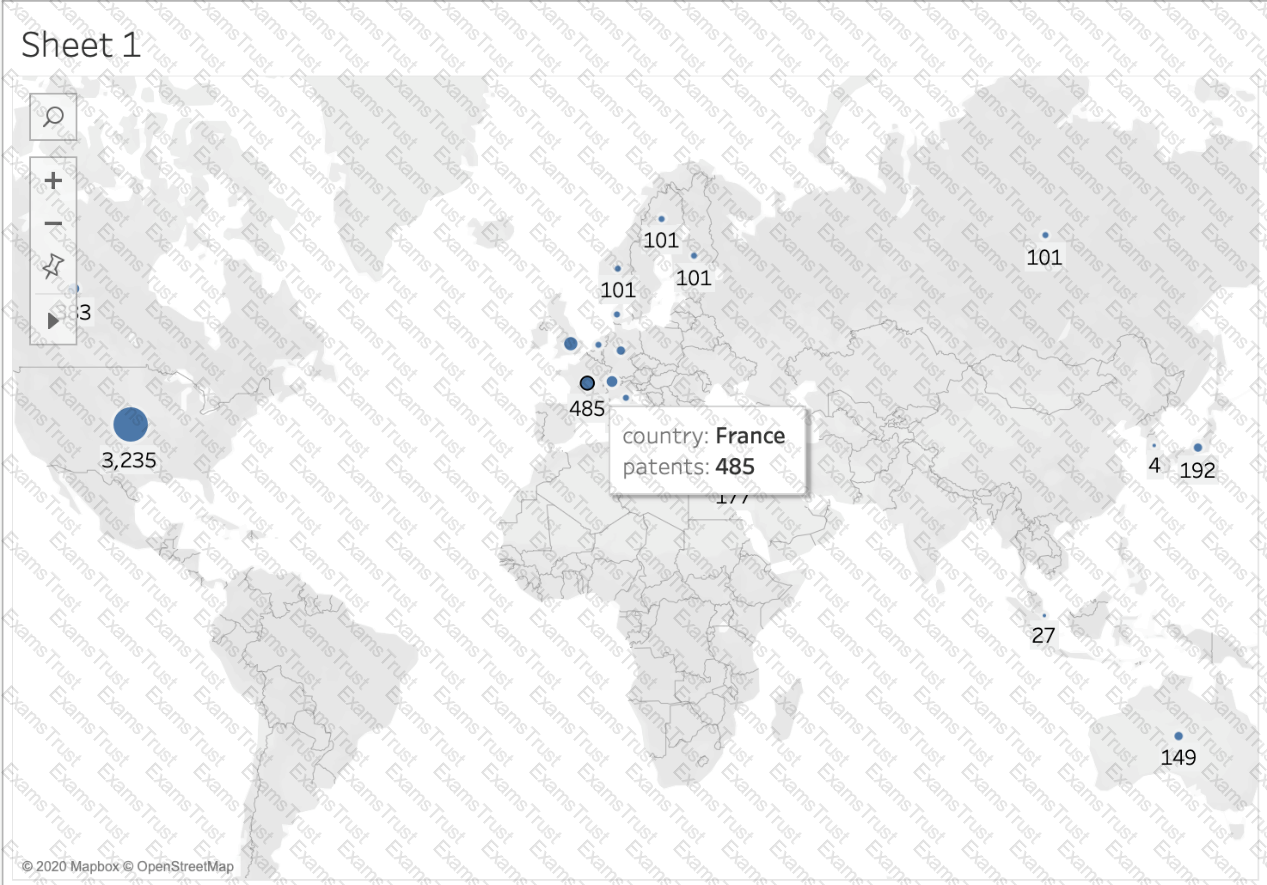
Using the cwurData table, plot a Map to see which country had the Second highest number of patents in the Year 2013?
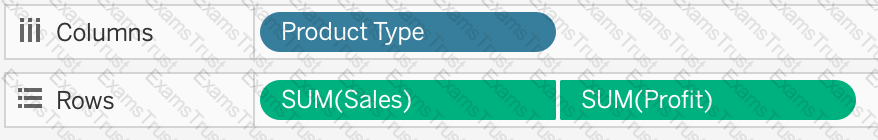
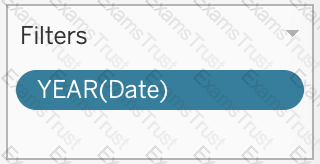
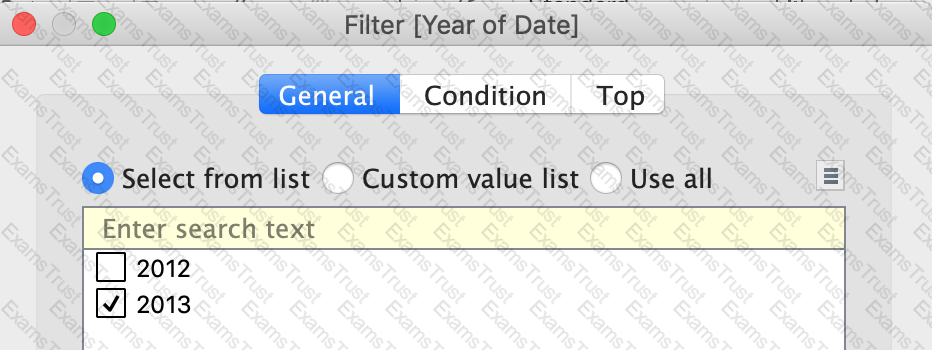
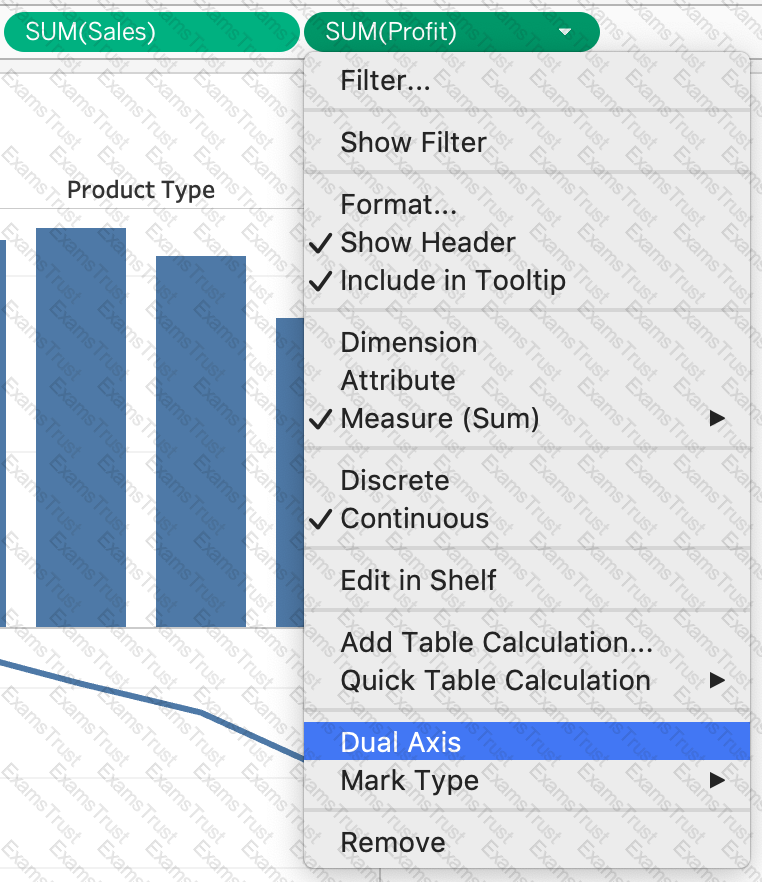
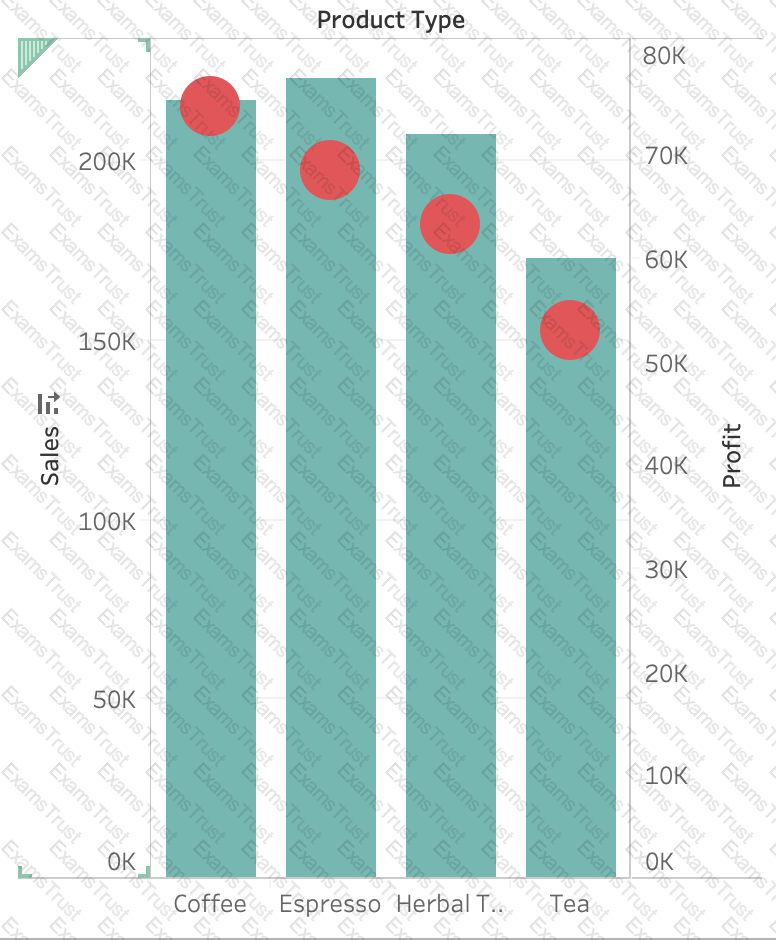
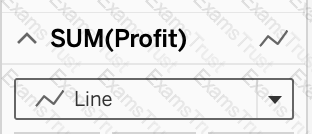
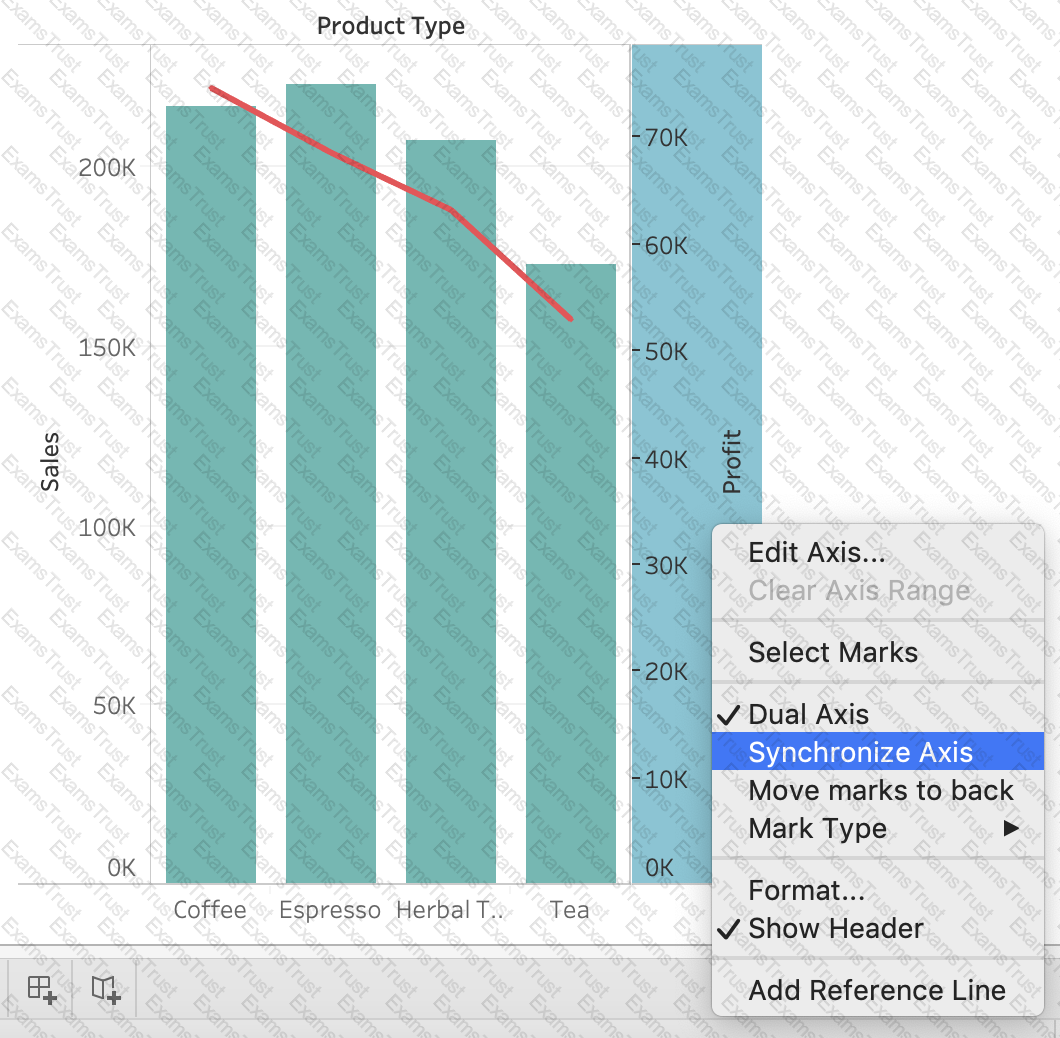
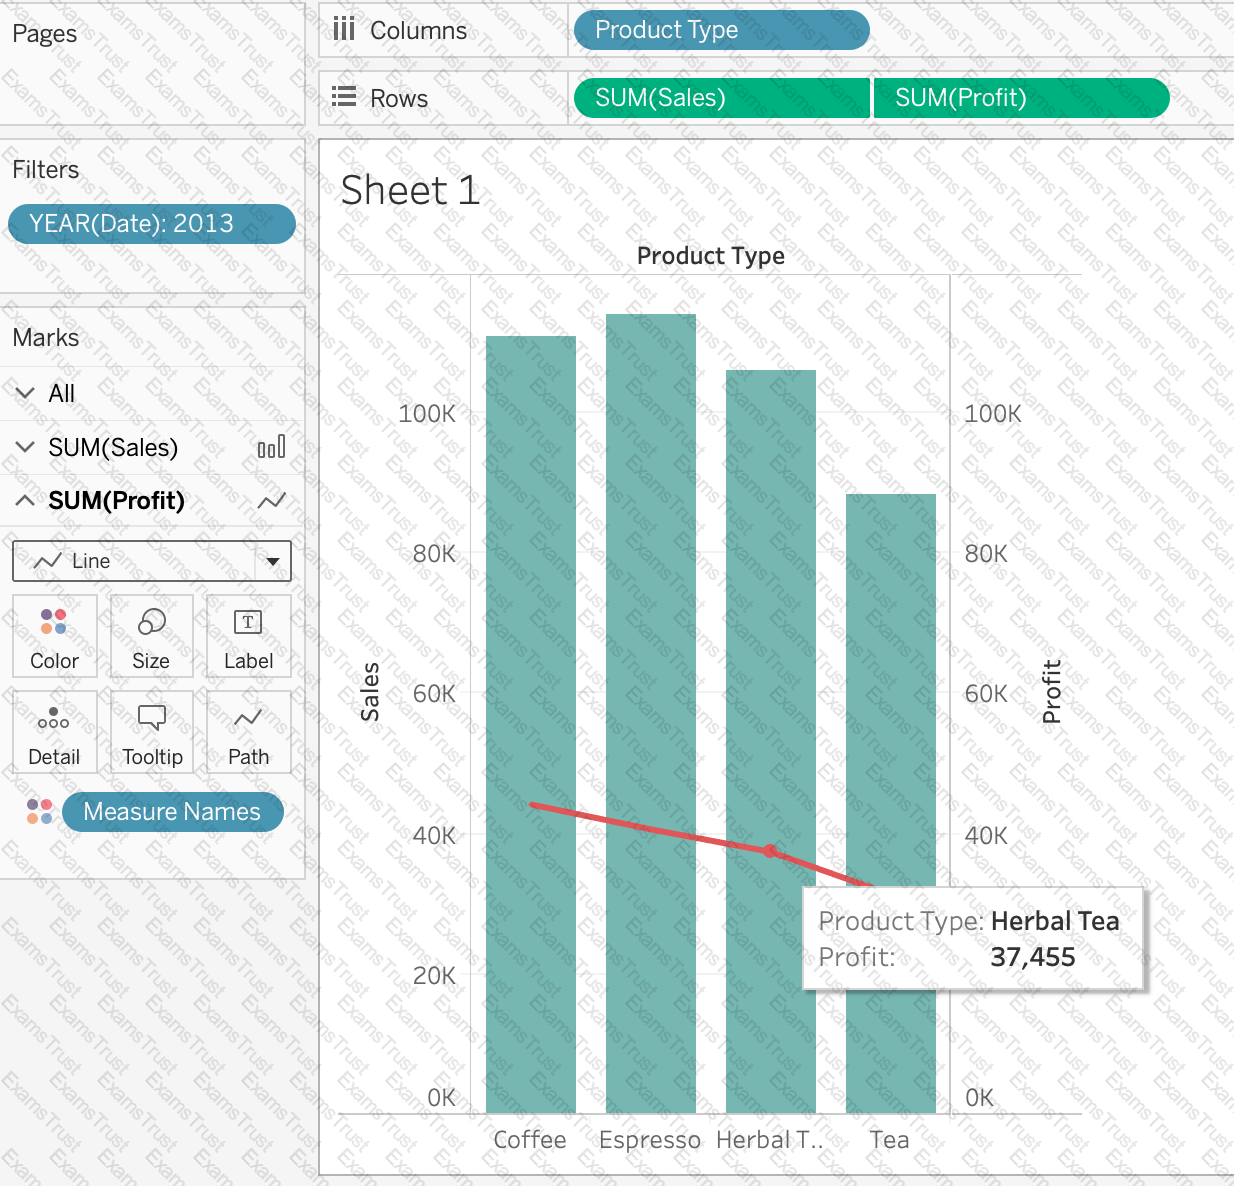
Using the CoffeeChain table, create a Dual Axis chart showing the Sales (Bar chart) and Profit (Line Chart) for each Product type. What was the Profit for the Herbal Tea product type in 2013?
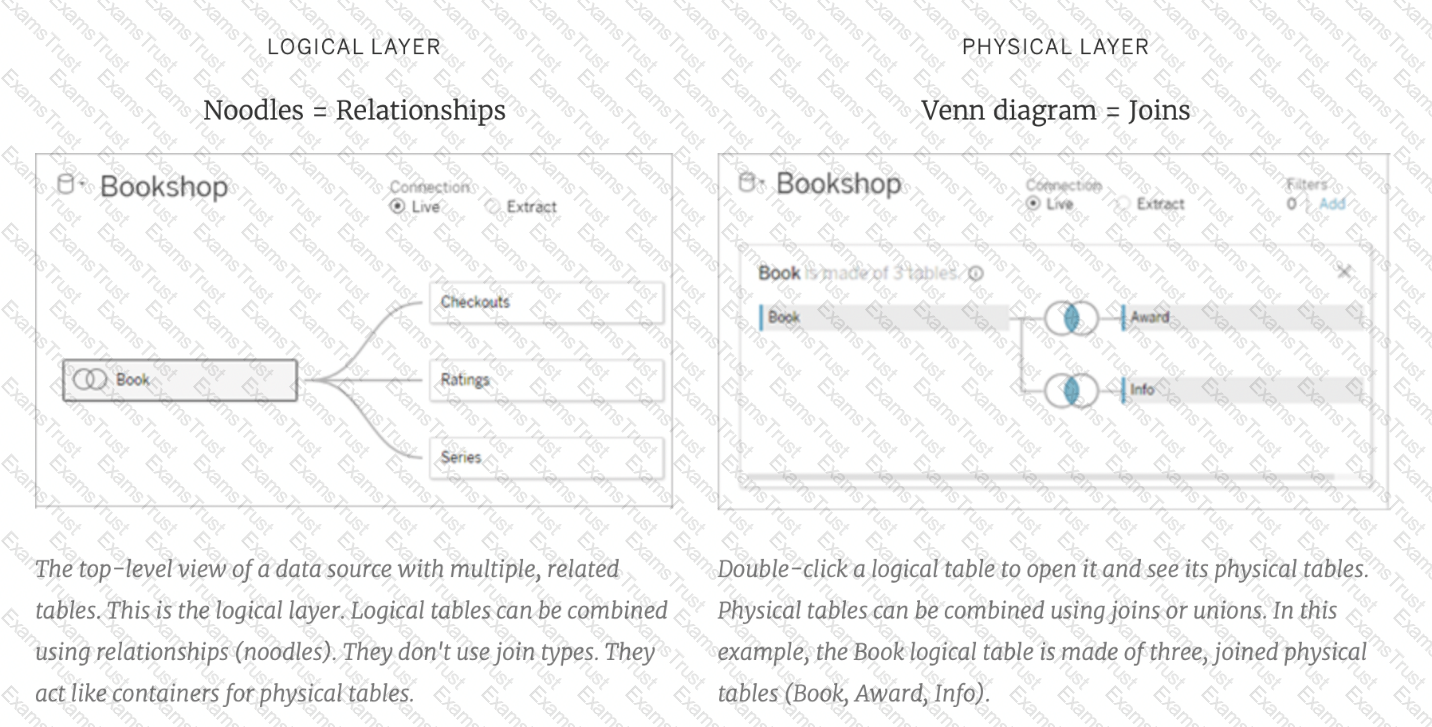
When should you use a relationship instead of a join for two data sets?
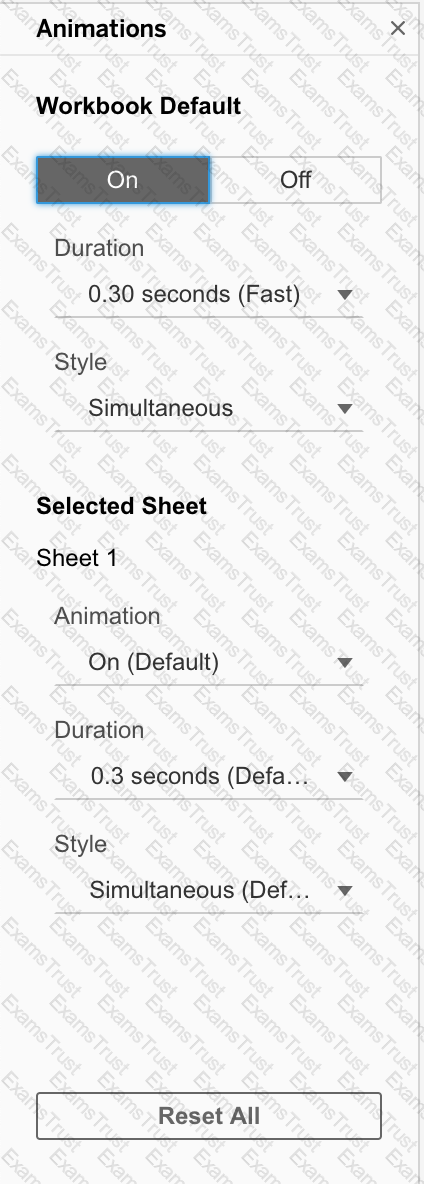
When using Animations in a Tableau, which of the following is the default duration for animations?
How does Tableau know at which level to aggregate values?
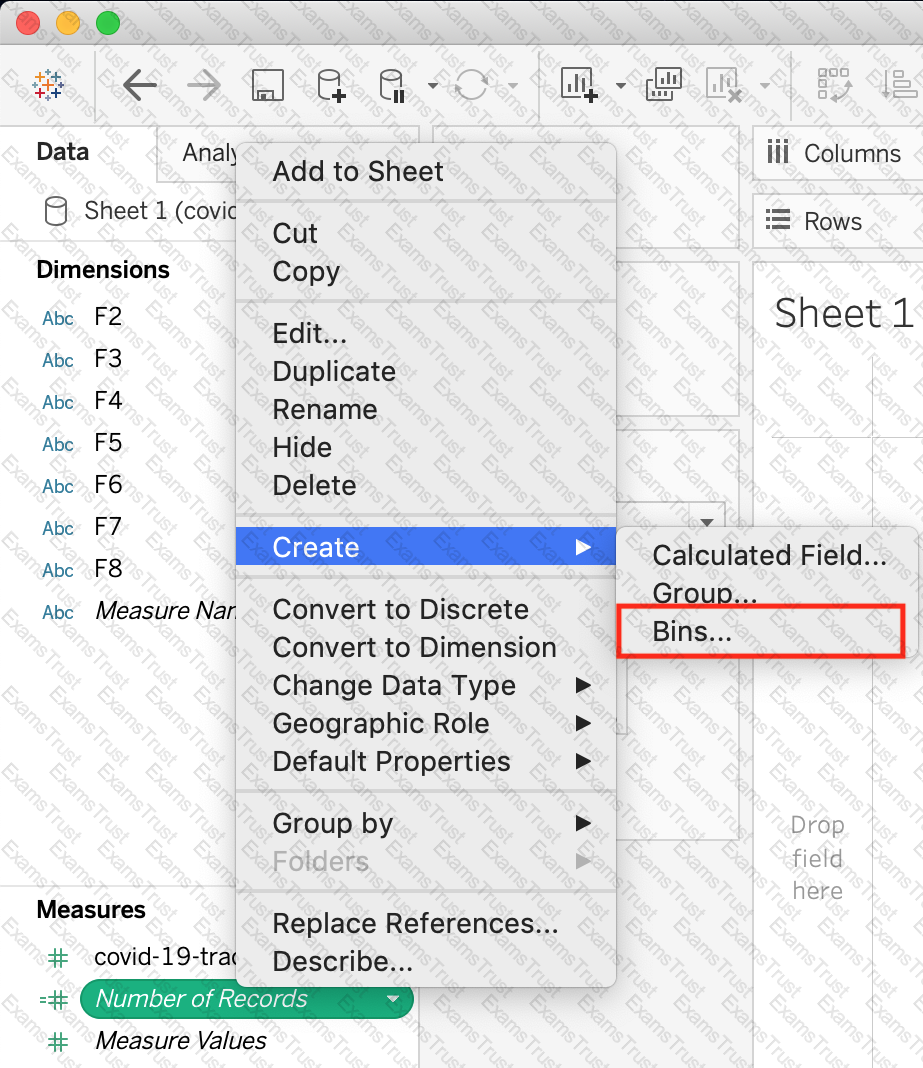
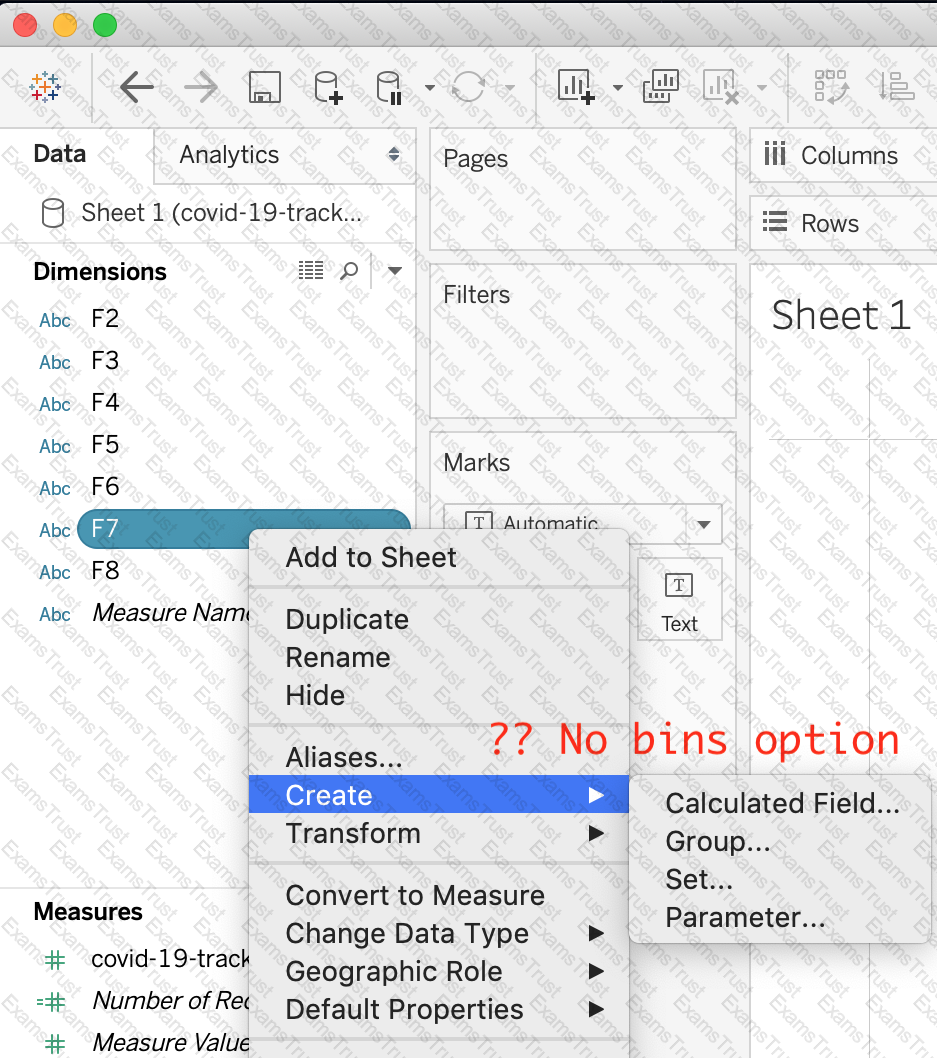
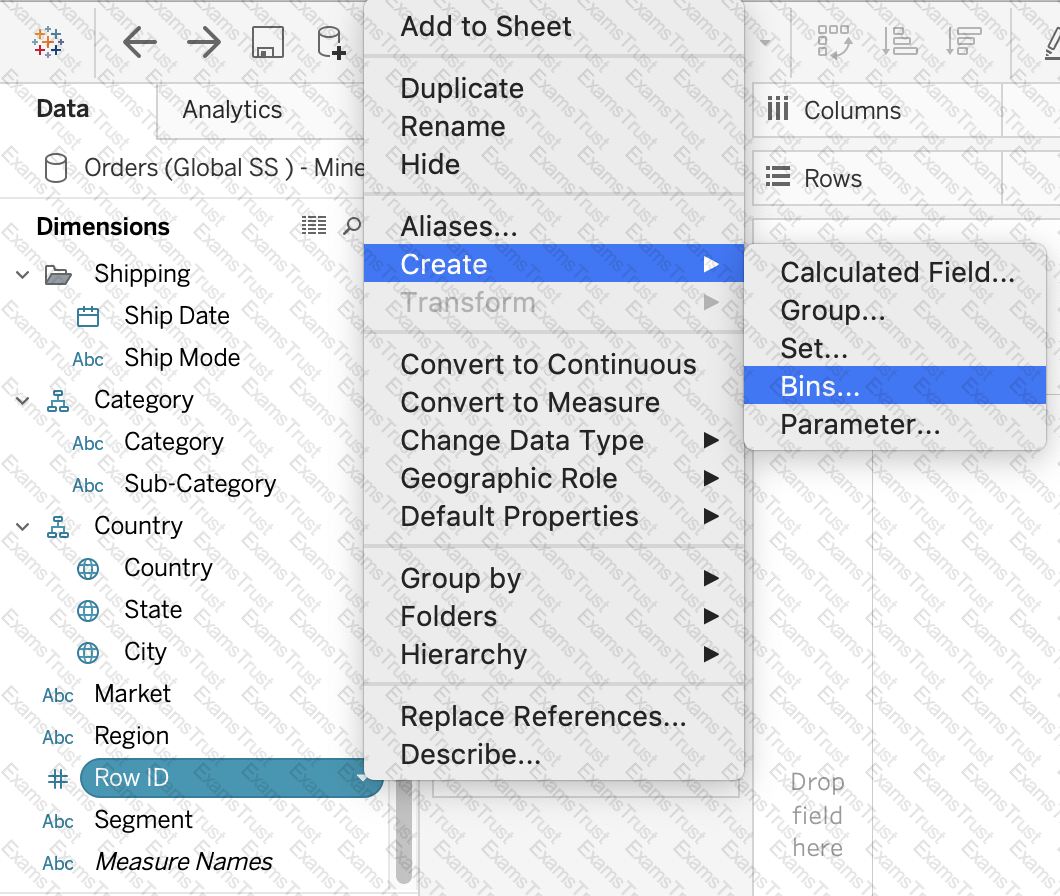
For creating variable sized bins we use __________________
True or False: A sheet cannot be used within a story directly. Either sheets should be used within a dashboard, or a dashboard should be used within a story.
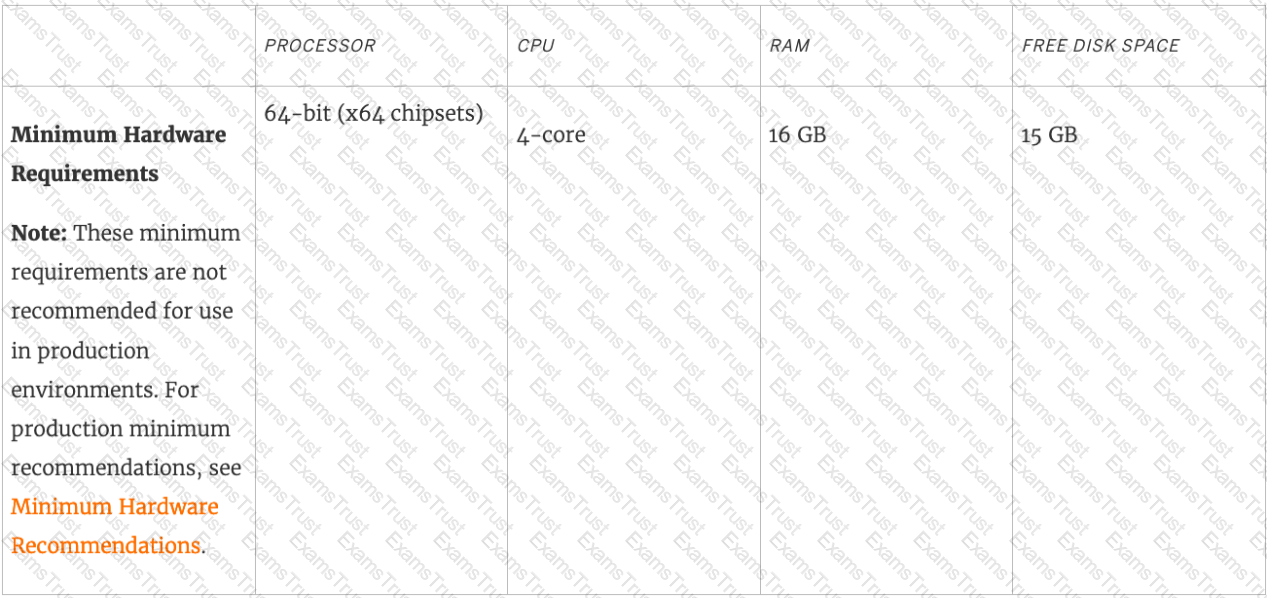
What is the minimum amount of RAM recommended for any production use of Tableau Server?
You can use the __________________ in Tableau to clean / organise your data.
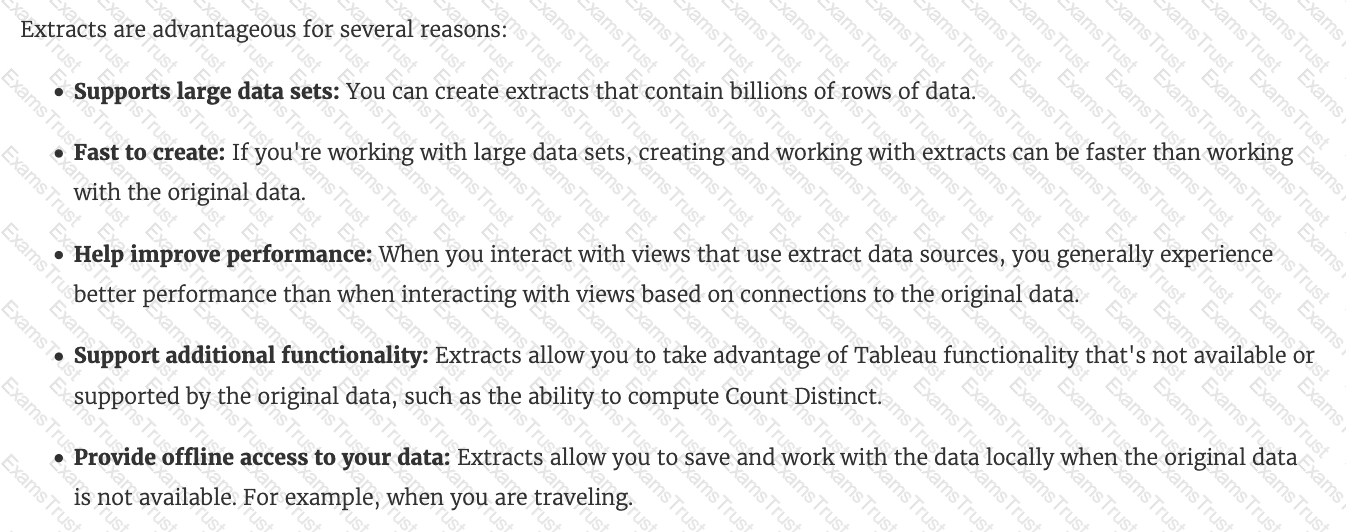
What are three benefits of using an extract as compared to a live connection to a data source? Choose three.
What are two use cases for a story? Choose two.
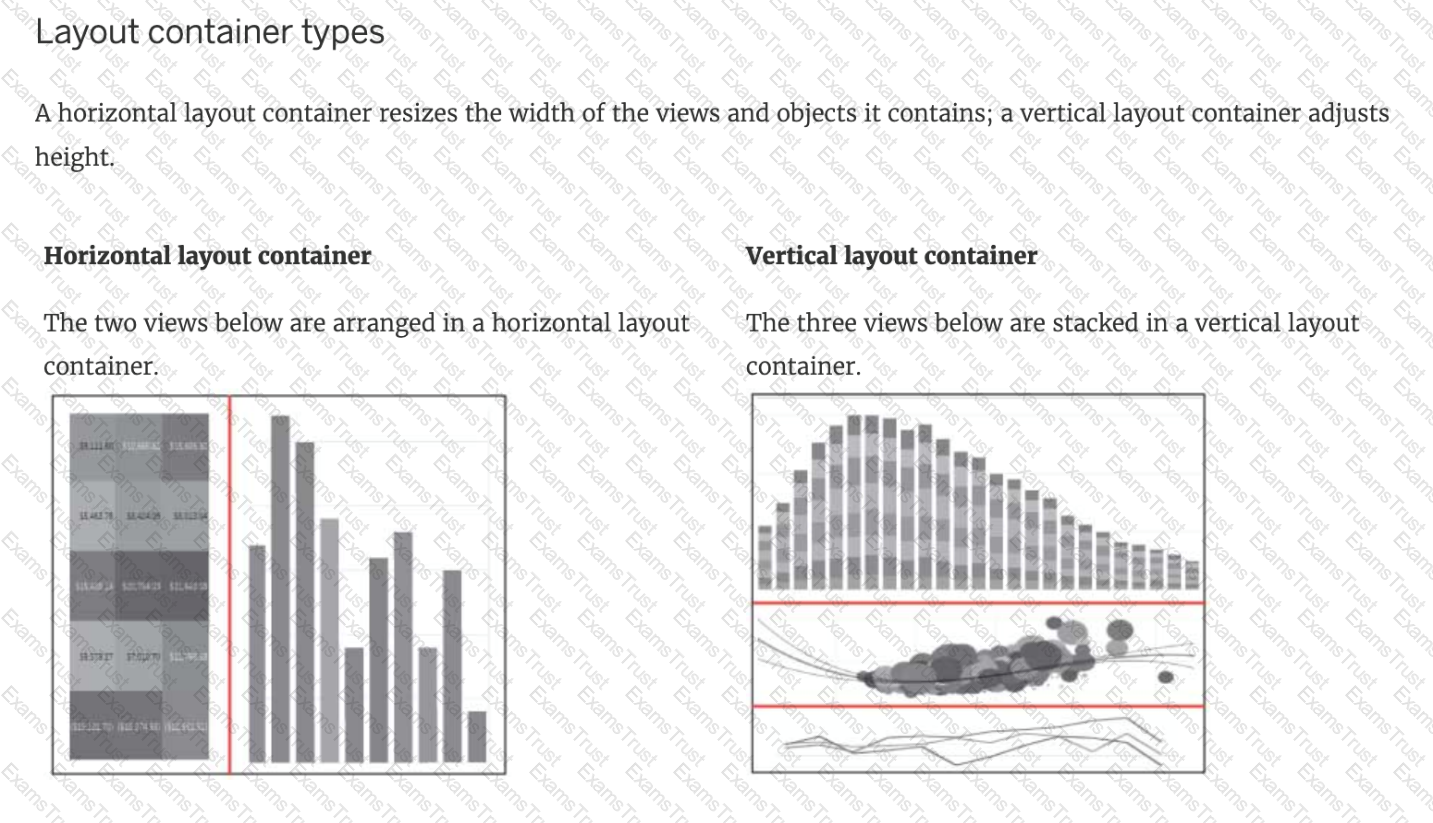
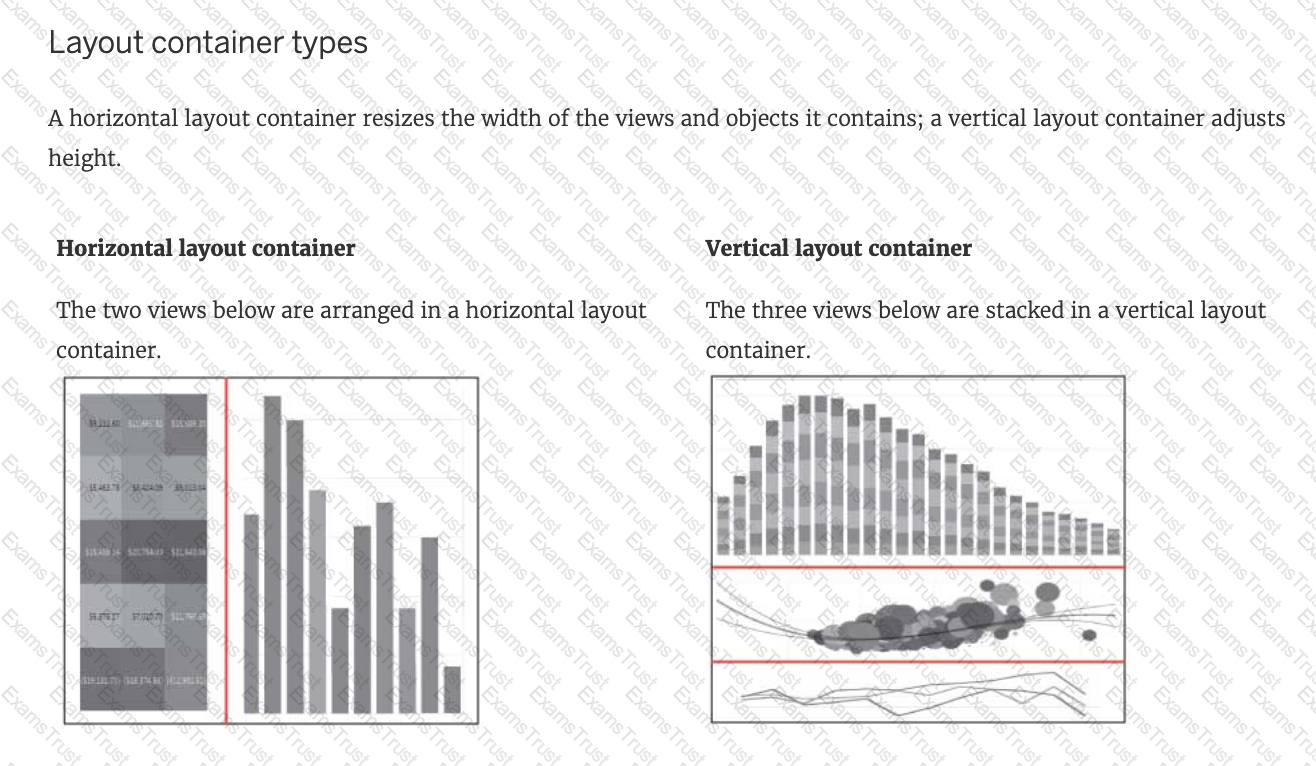
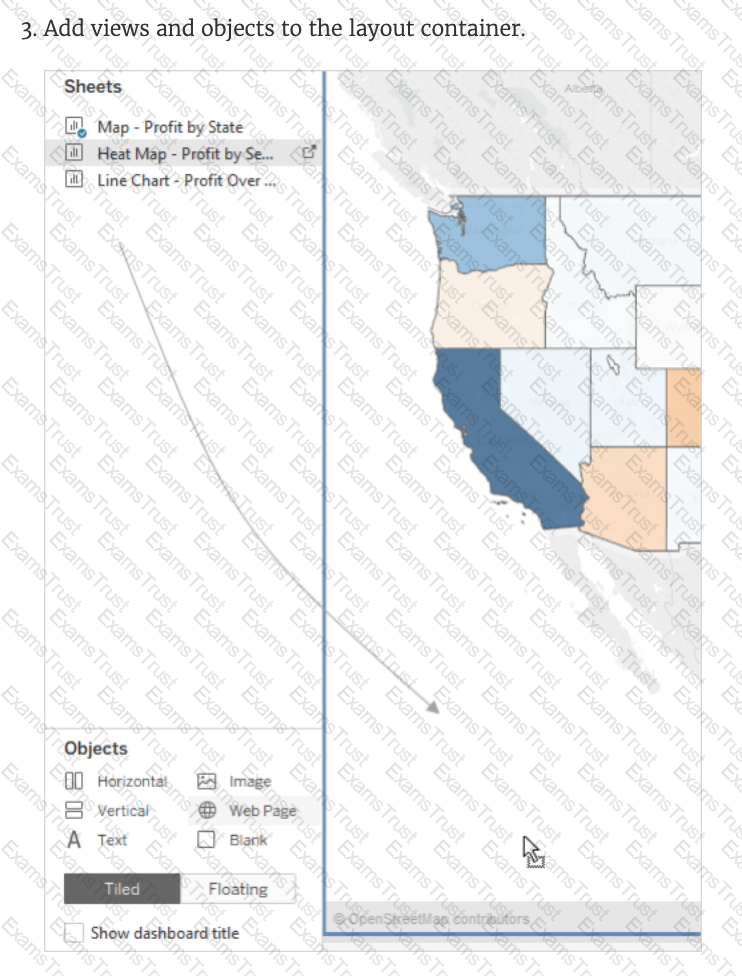
Which of the following are valid Layout Container types when using Dashboards in Tableau?
__________ is a technique in Tableau which will identify marks with similar characteristics
Question 30: Skipped
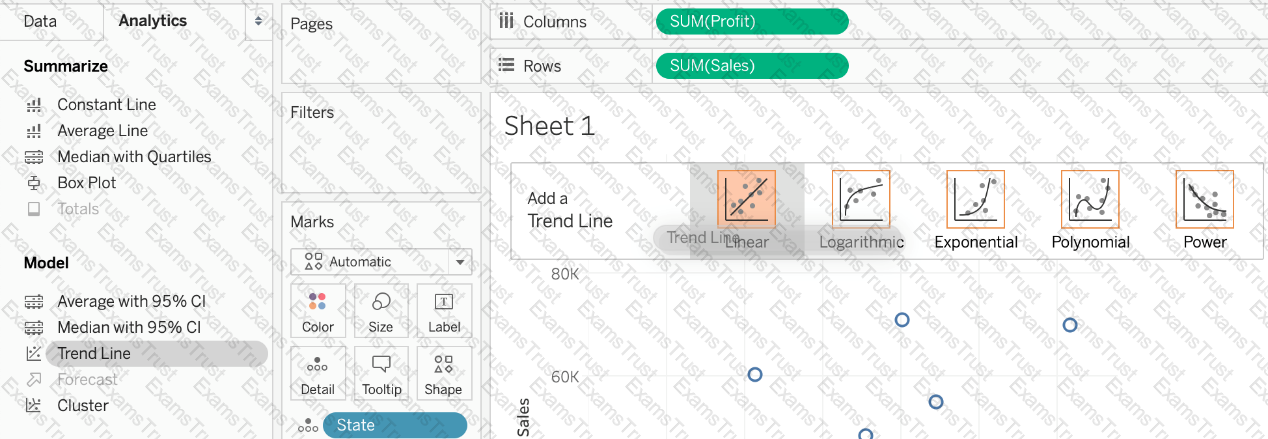
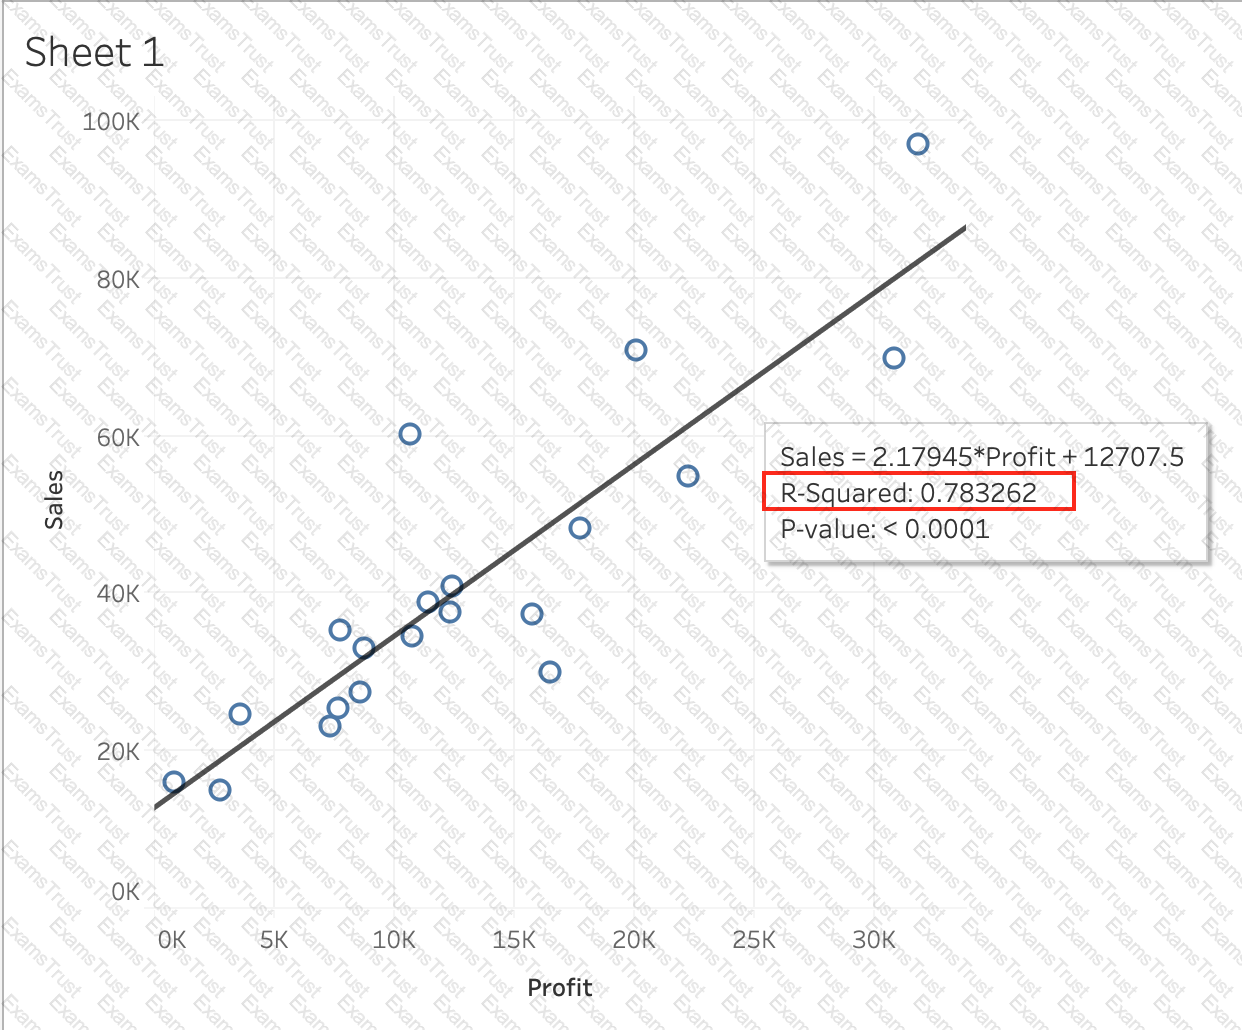
Using the CoffeeChain table, create a scatter plot of Profit (x-axis) vs Sales (y-axis) broken down by State. Add a Linear trend line to the view. What is its R-squared value?
Given a map, which of the following fields can be placed in Size,Shape,Detail,Color
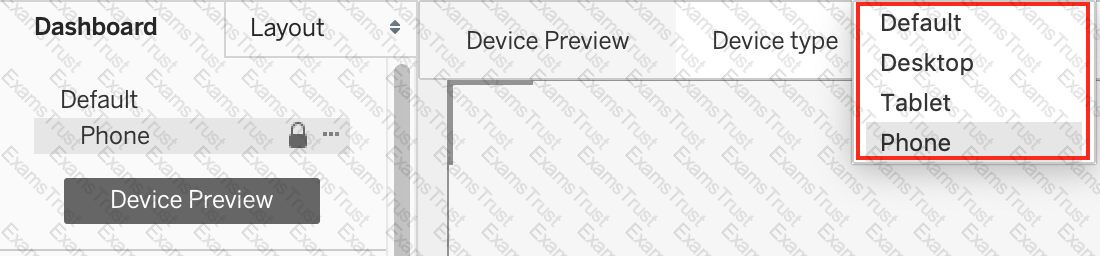
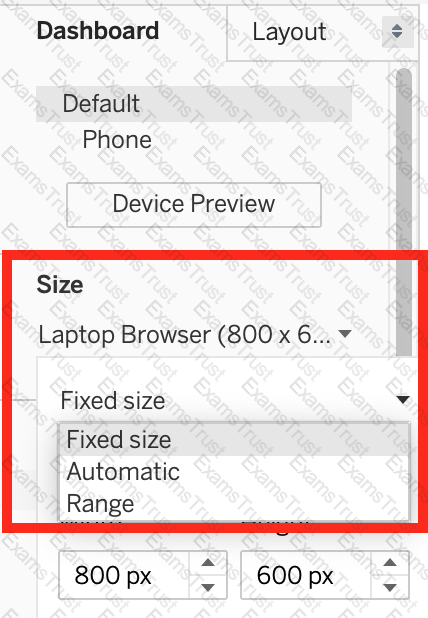
When creating a dashboard for multiple devices, which of the following Device options are available in the Device Preview section?
True or False: It is possible to add a field to more than one hierarchy
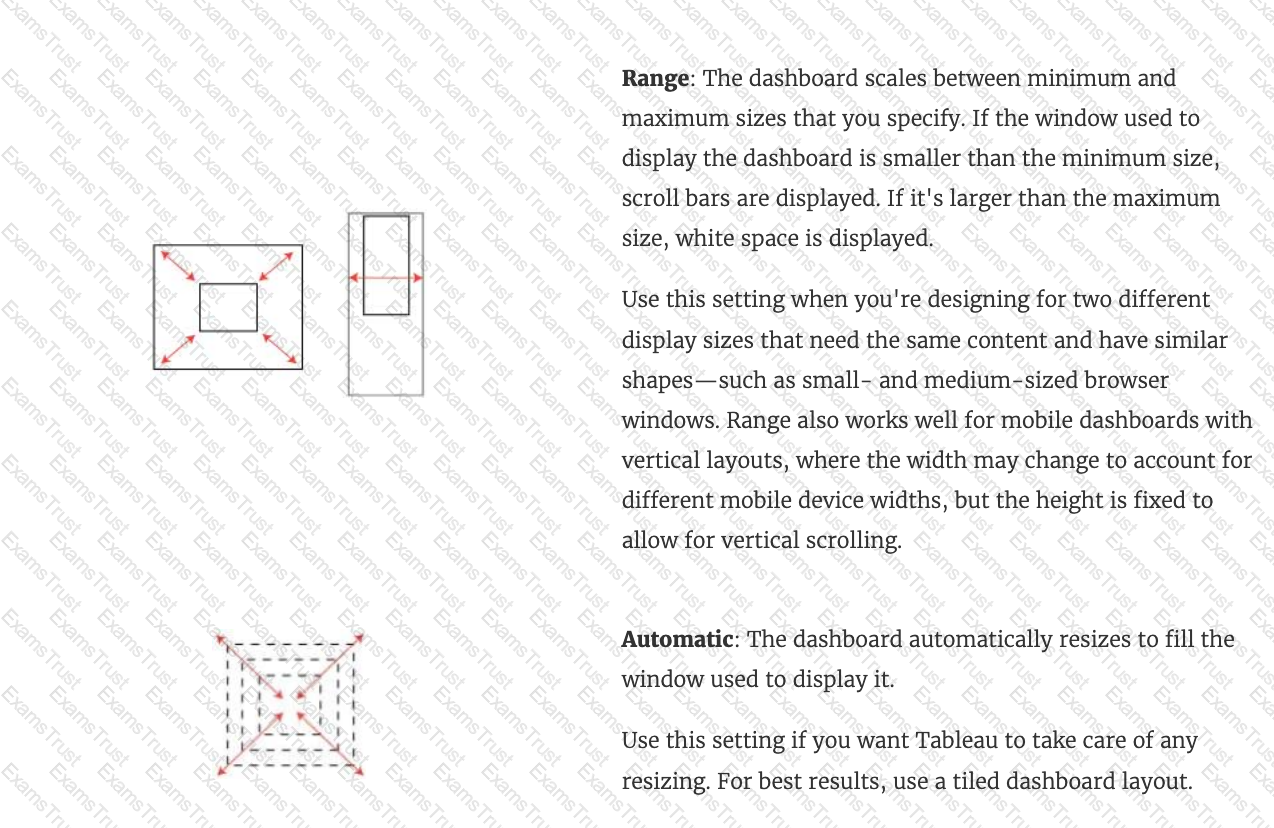
Which of the following are valid Dashboard size options?
You have a continuous numeric measure named Sales.
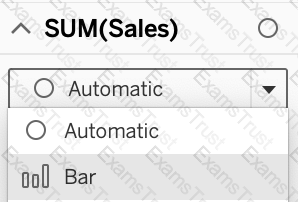
Which chart type is created when you double-click the Sales measure?
Skipped Join the Geo Data and Time Series Table on the Item Number ID column, and display the Store count for every State on a Map. What was the Store count in 2017 for Texas (TX)?
Join the Geo Data and Time Series Table on the Item Number ID column, and display the Store count for every State on a Map. What was the Store count in 2017 for Texas (TX)?
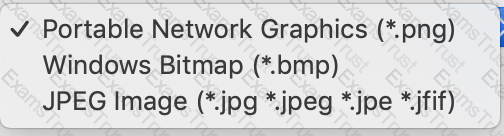
When exporting a worksheet as an image in Tableau, which of the following file formats are available?
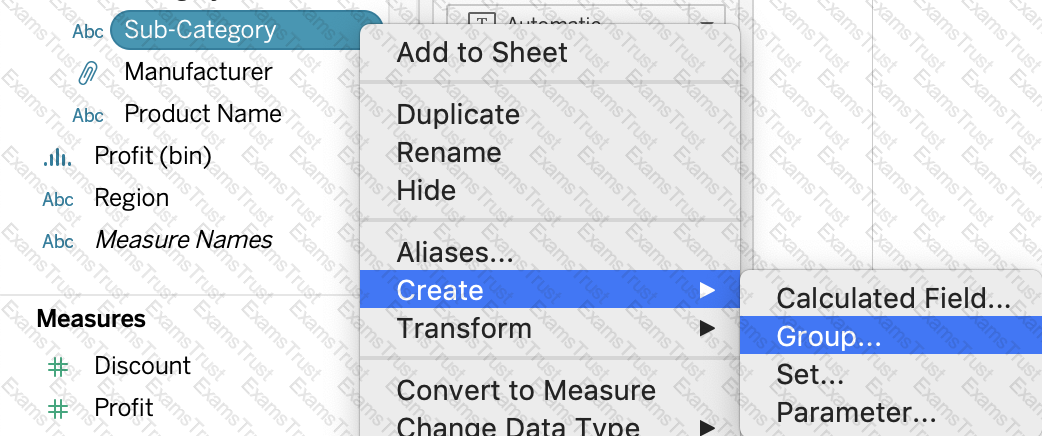
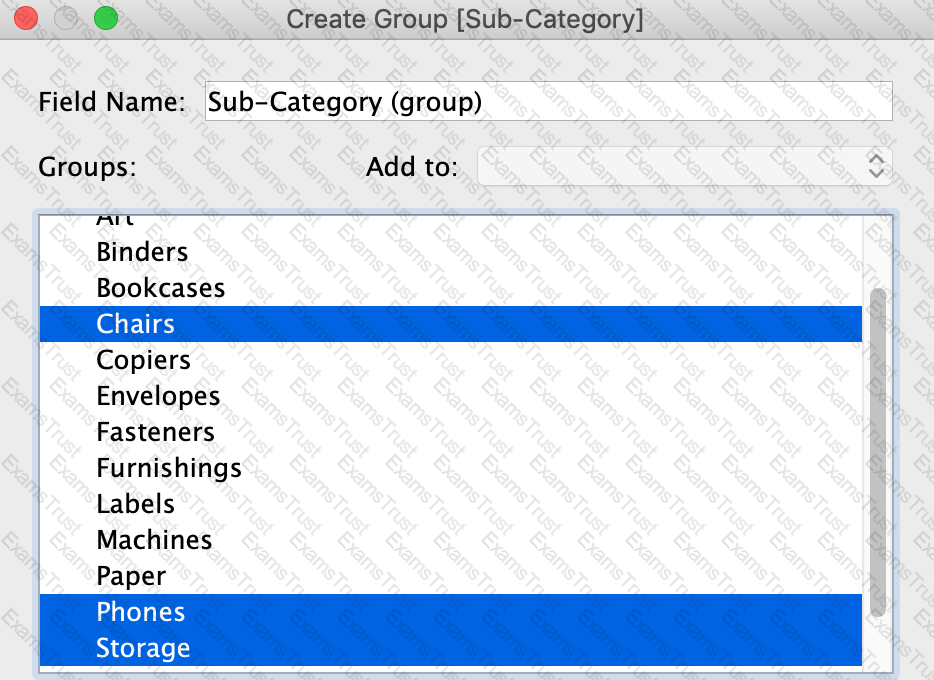
What are two correct methods for creating a visual group? Choose two.
The default path for all supporting files, data sources, icons, logs etc is in ______________________
What are two correct methods to change the data type of a field? Choose two.
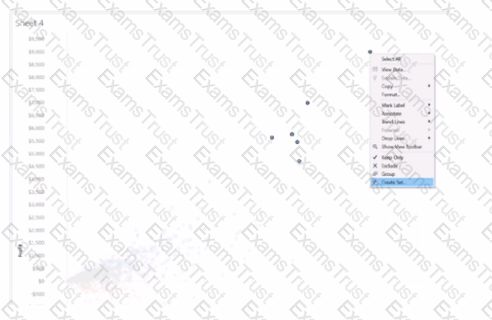
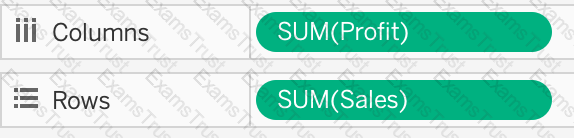
You have a scatter plot visualization.
What should you do to configure the visualization as a density map?
Which three elements are included in a packaged workbook (.twbx)? Choose three.
_____________ is a snapshot of the data that Tableau stores locally. Good for very large datasets of which we only need few fields.
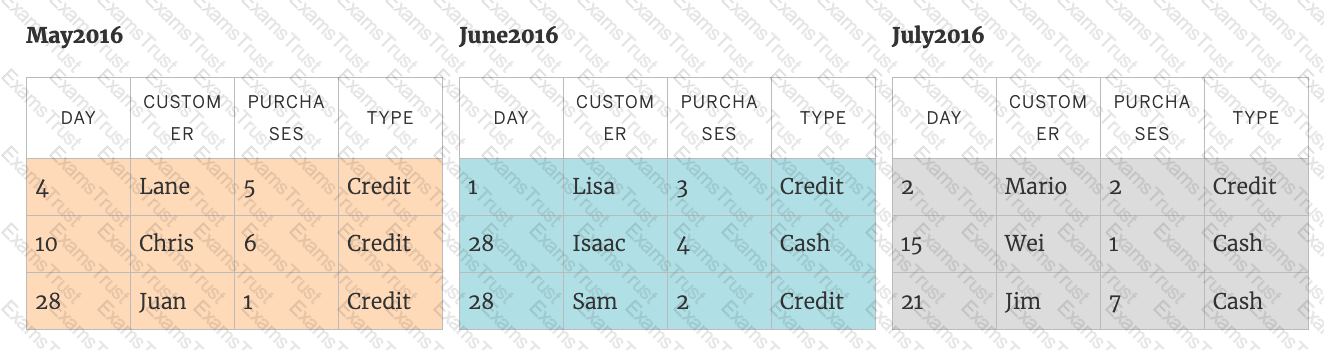
When field names in the Union do not match, then:
You have a workbook that contains one data source and you need to combine data from another database. What should you do first?
The View Data window displays as much of the data as possible by default, up to _______________ rows.
What are two requirements to combine two tables by using a union? Choose two.
Which of the following are true about Dashboards in Tableau?
Which type of date filter can you use to choose a range of dates based on TODAY ()?
Given a map, which of the following fields can be placed on Size,Shape,Detail,Color
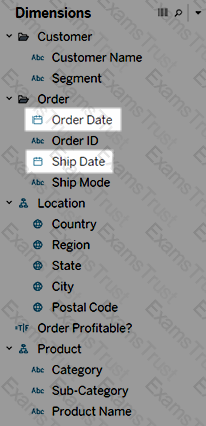
Which of the following fields would be best used as Dimensions?
True or False: A reference line cannot be added from the Analytics Pane
Download the Dataset from:
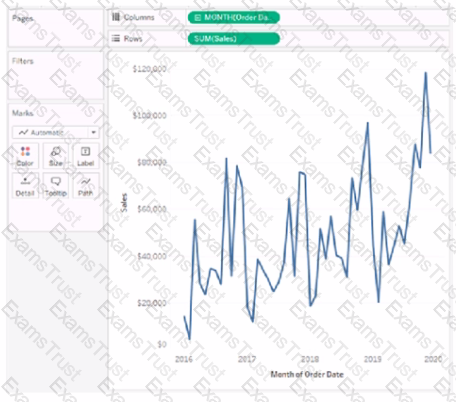
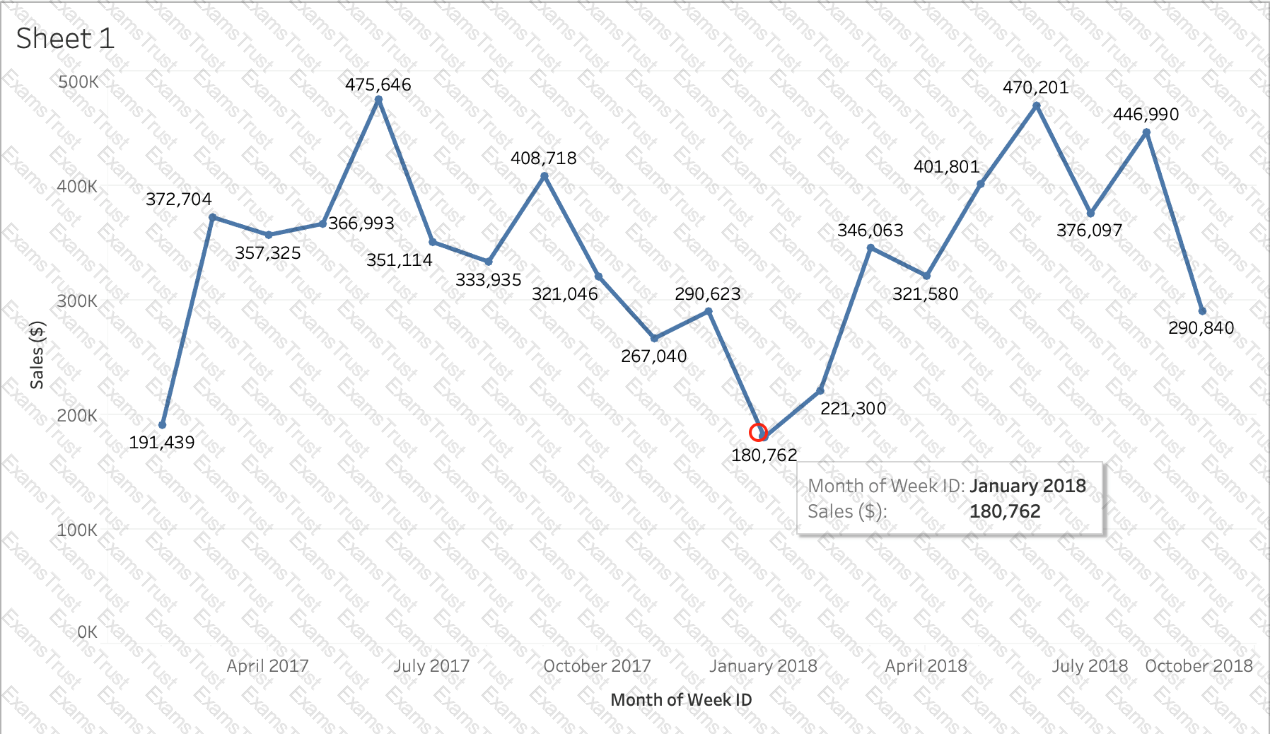
Using the Time Series Table, create a line chart to show Sales over time. Which Month and Year witnessed the lowest Sales?
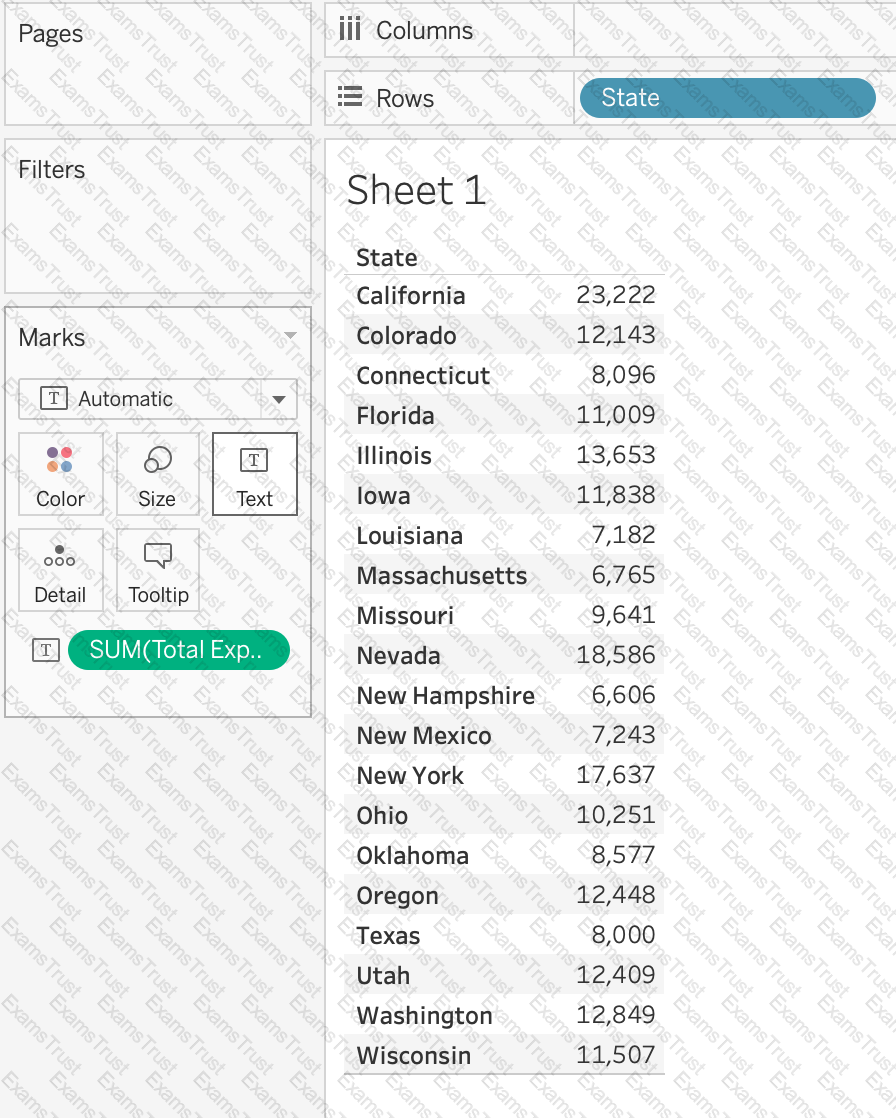
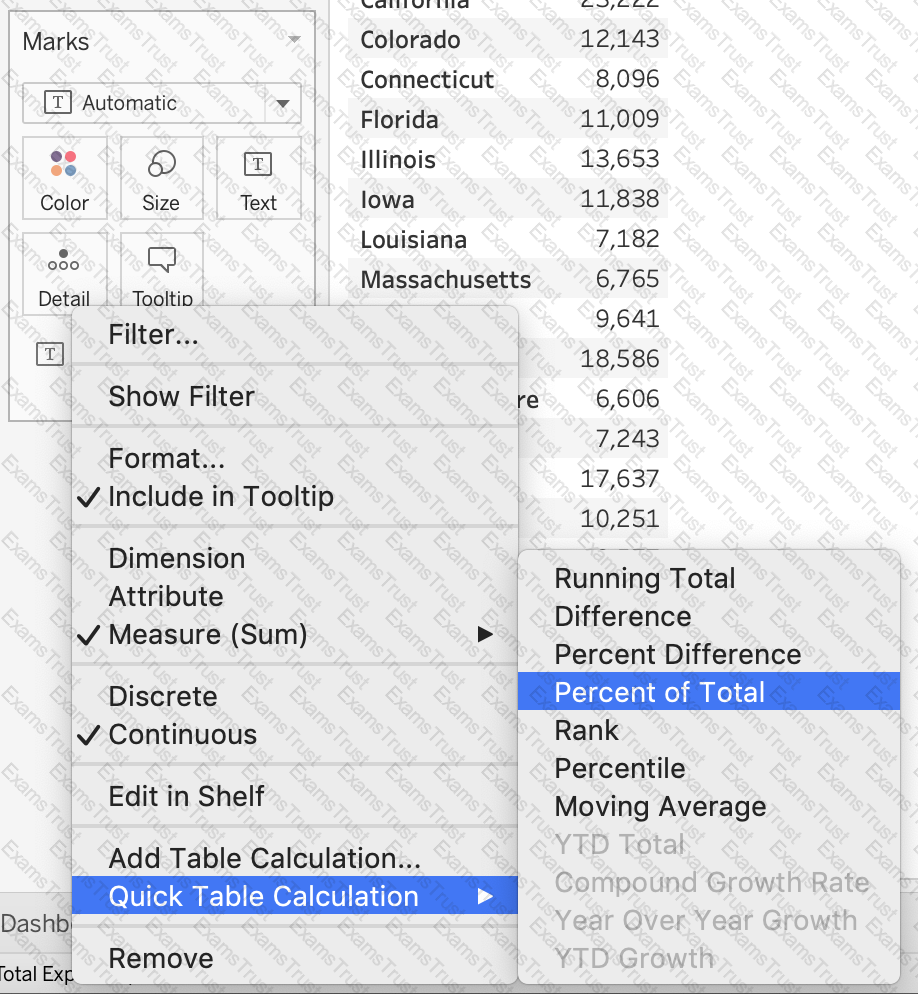
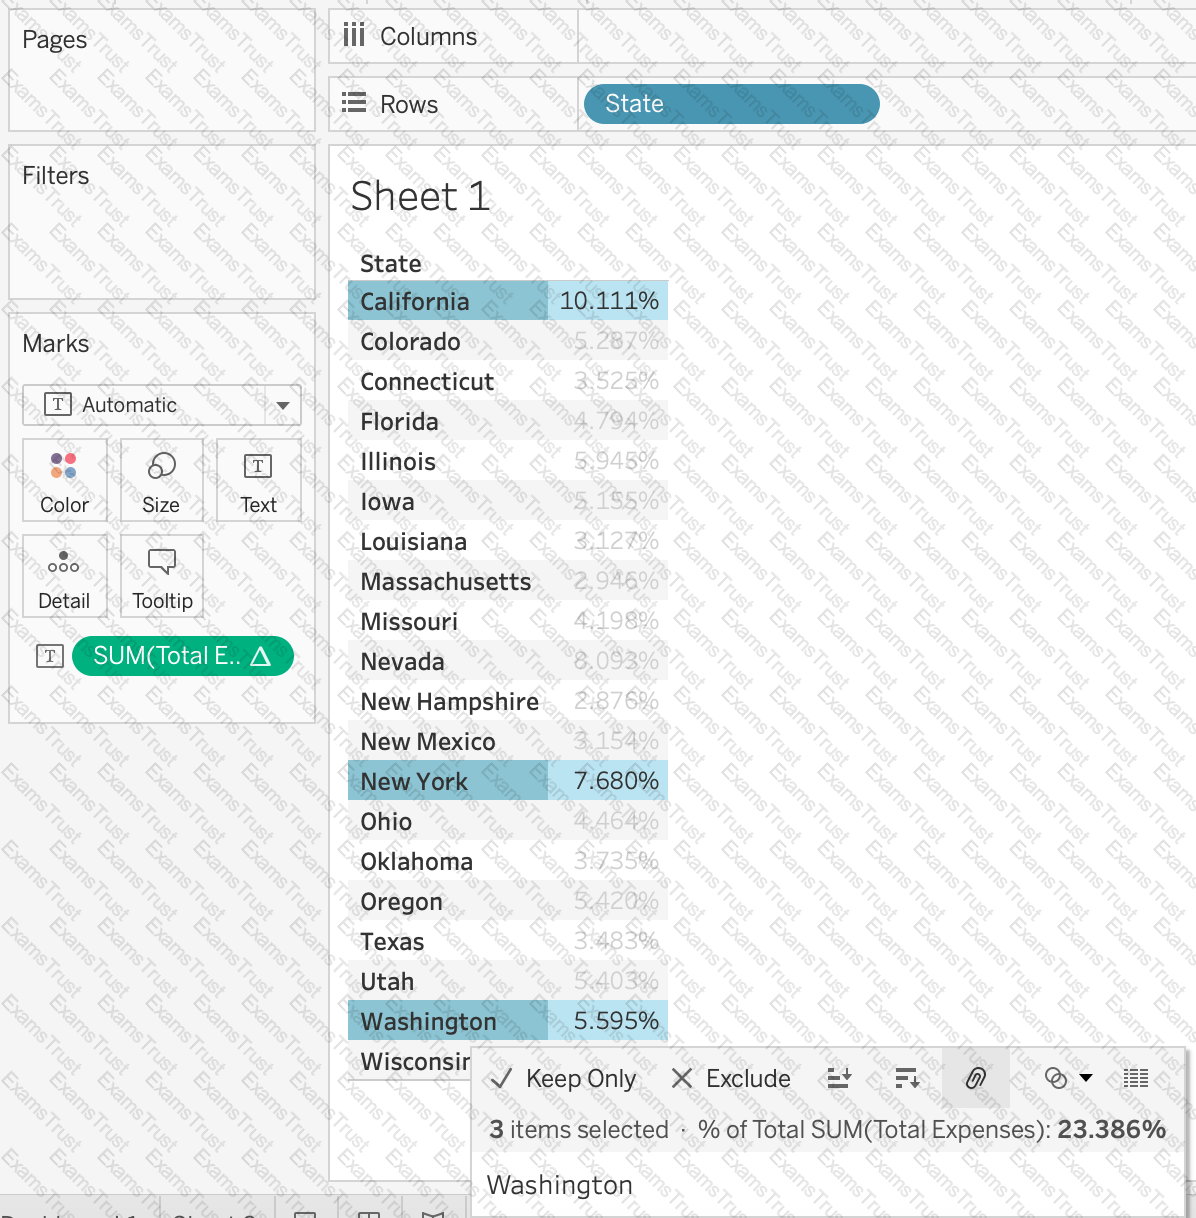
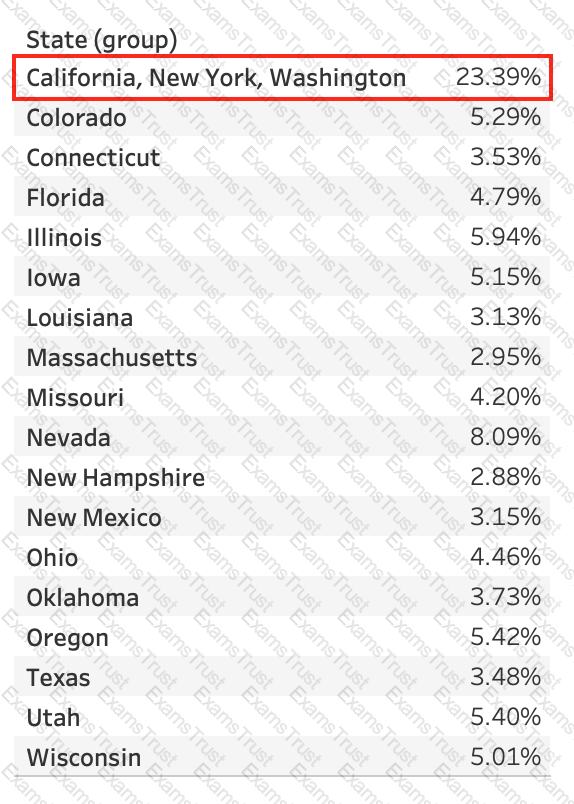
Using the CoffeeChain table, create a crosstab showing the Total Expenses per State and add Column Grand Totals to the view. Now group the states of New York, California and Washington. What percent of the total sales does this group contribute?
Is it possible to add both a Dashboard and a Worksheet at the same time to a Story Point in Tableau?
What allows you to drill up or down in the level of detail (LOD)?
Is SUM a table calculation?
Which of the following are benefits of using Data Extracts in Tableau?
In order to avoid any confusions, what should you do after creating a Dual-axis chart?
The icon associated with the field that has been grouped is a ______________
As a general best practice, how many categories can a pie chart display effectively?
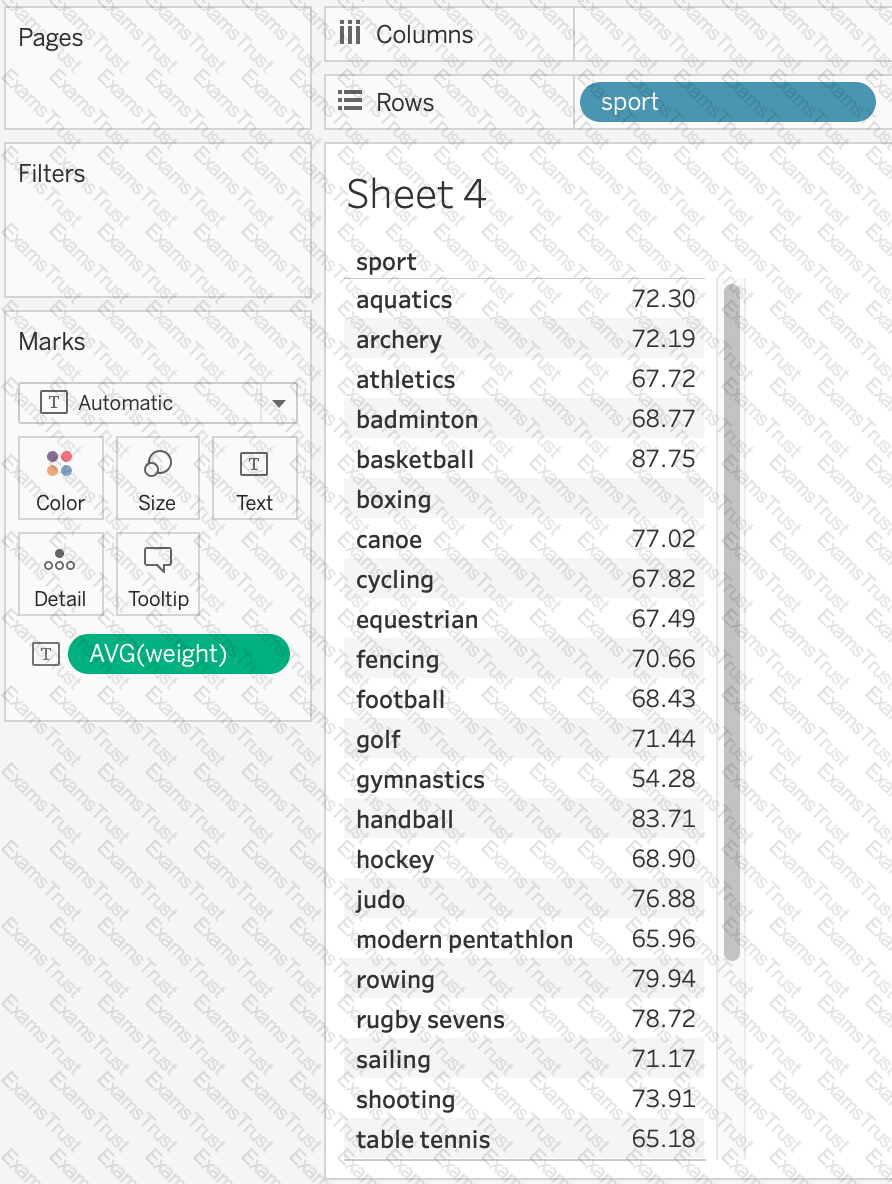
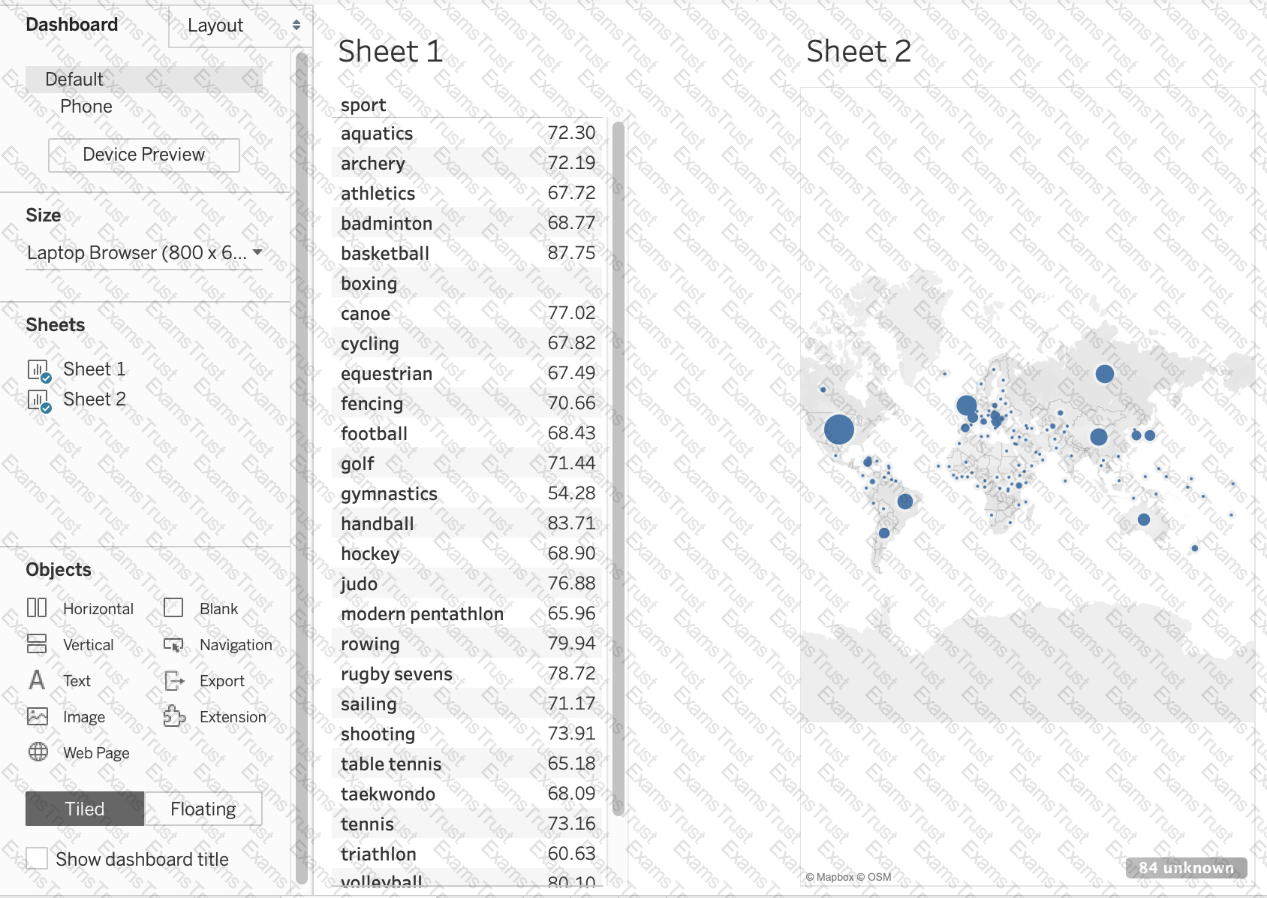
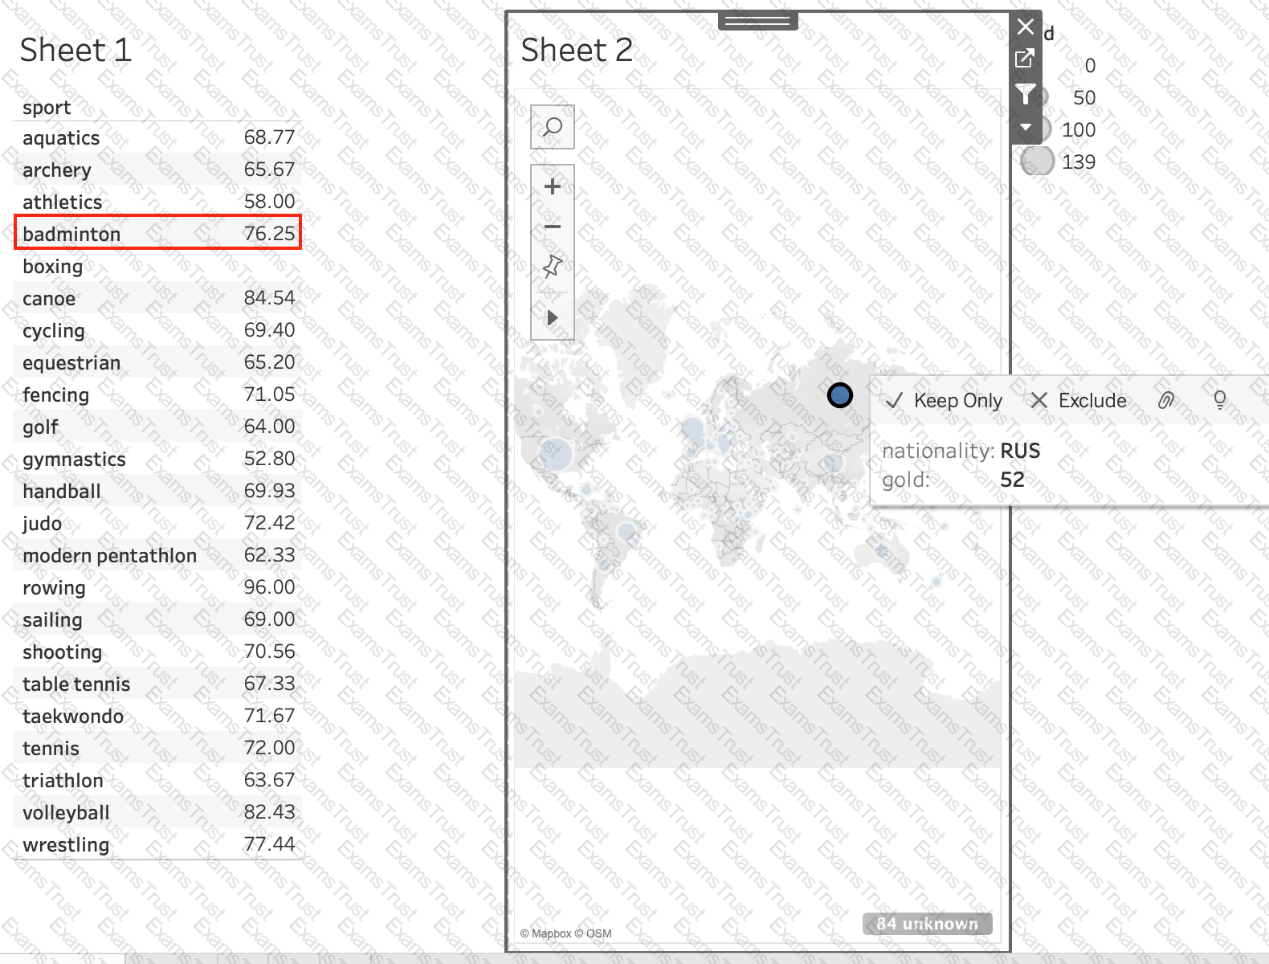
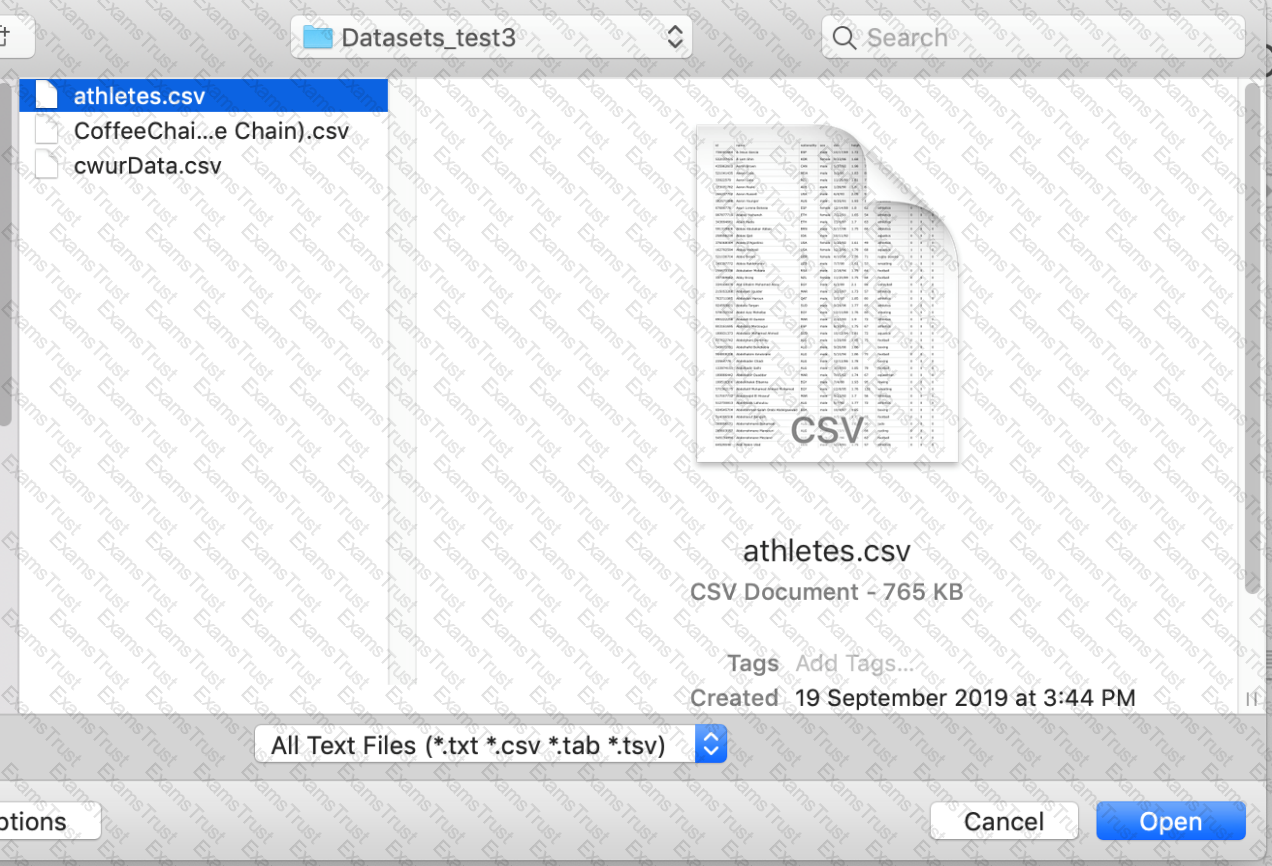
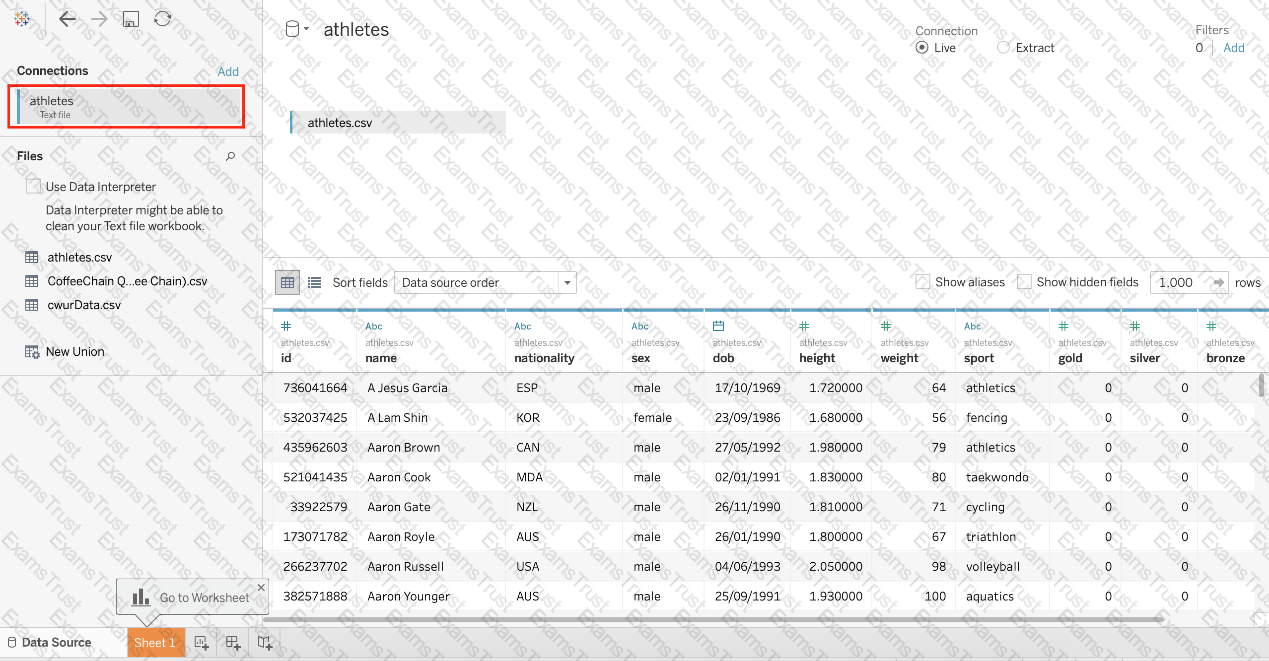
Using the atheletes table:
i) Create a sheet with a crosstab showing the Average weight for each sport (Sheet 1)
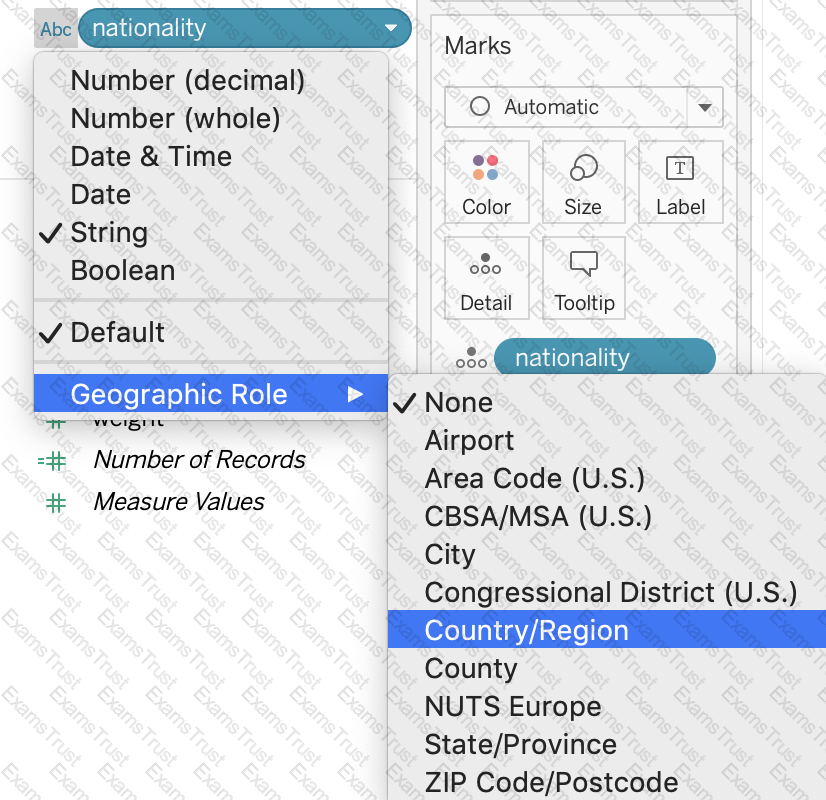
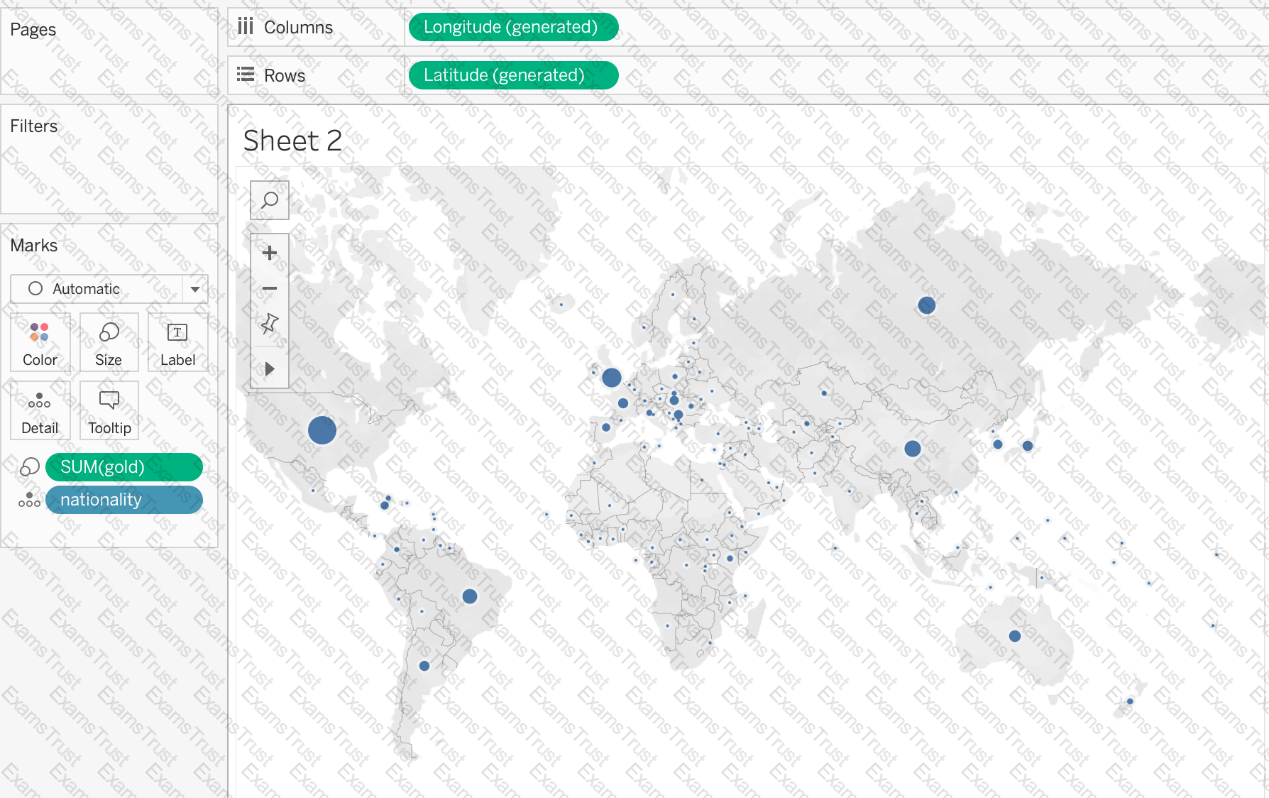
ii) Create a sheet with a Map showing the Total number of gold medals per Country. Use size as a Mark. (Sheet 2)
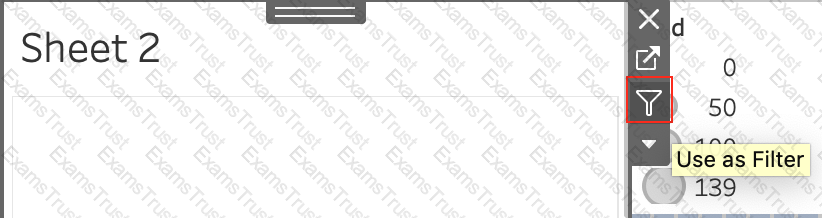
Now, Create a Dashboard containing both these sheets, and Use Sheet 2 as a Filter for Sheet 1. What was the average weight for Badminton in Russia?
(Ignore any nulls / unknowns)
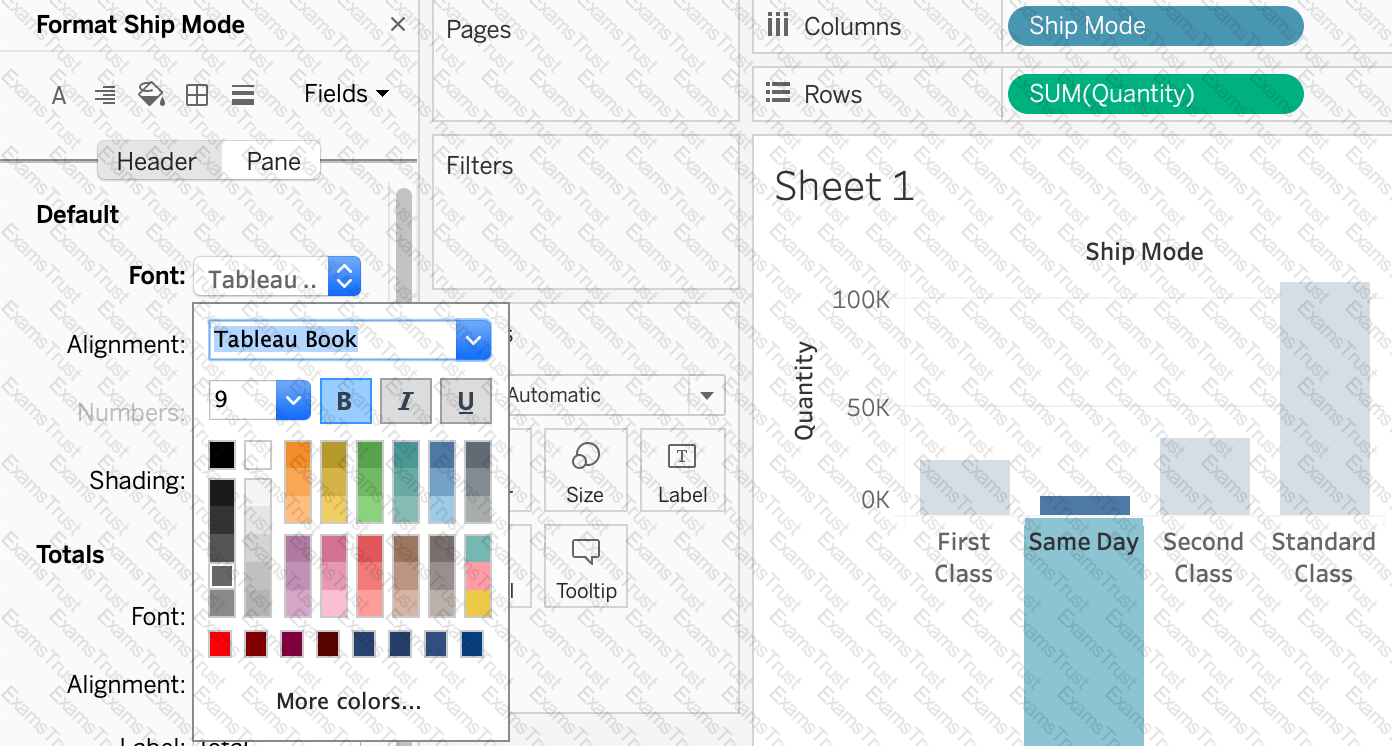
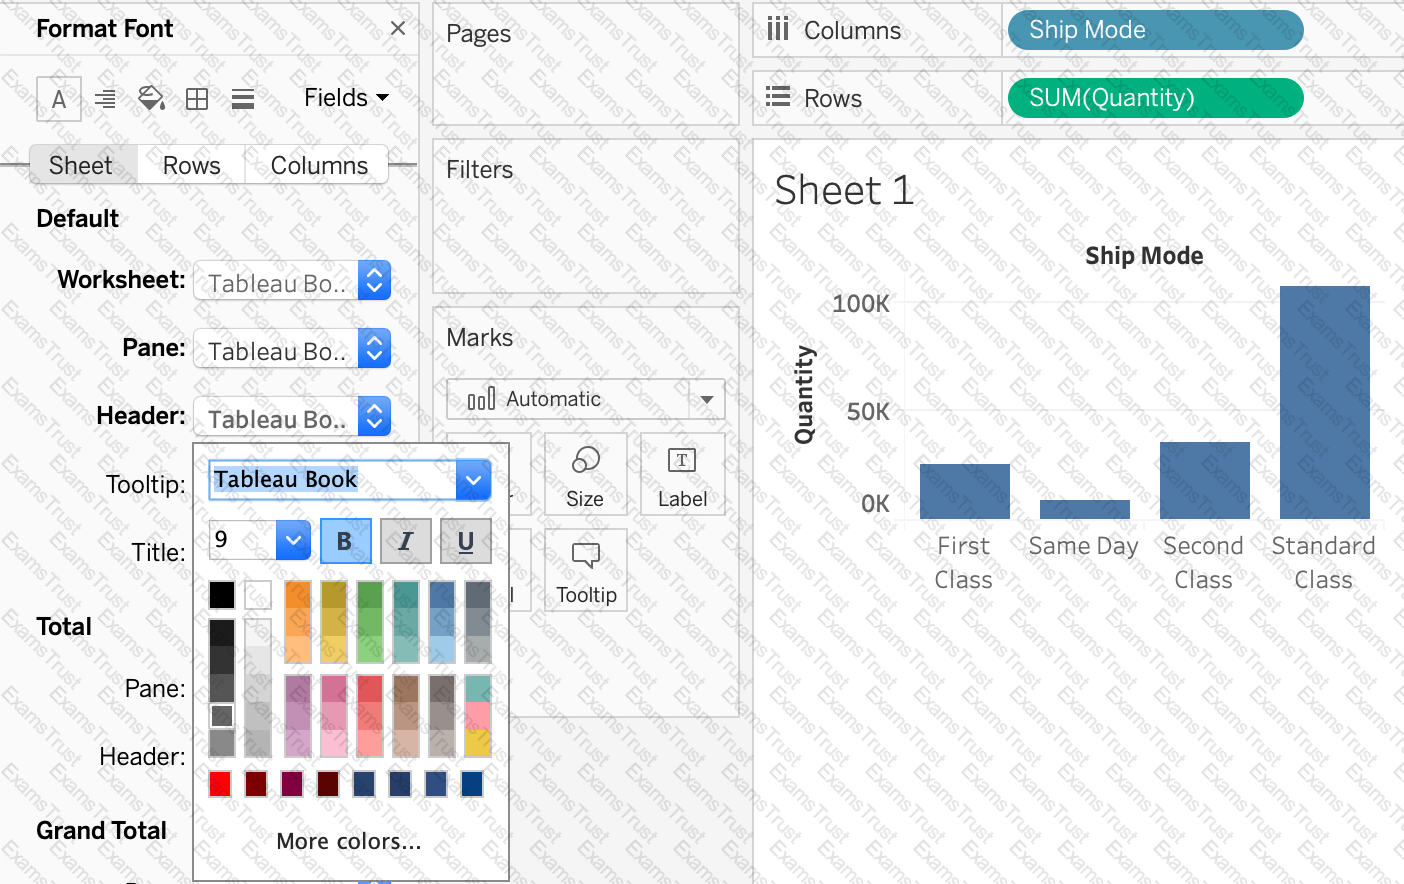
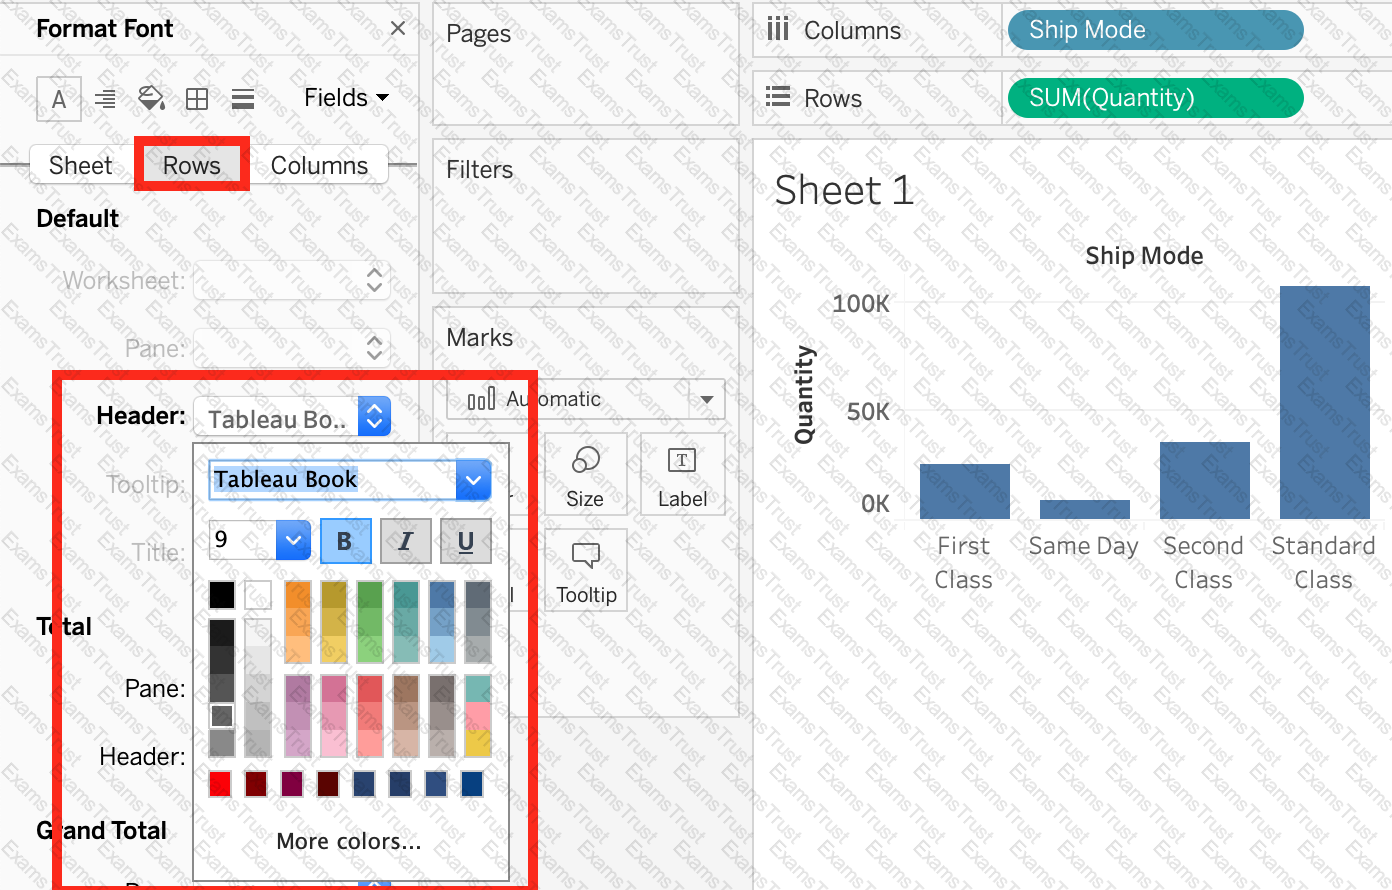
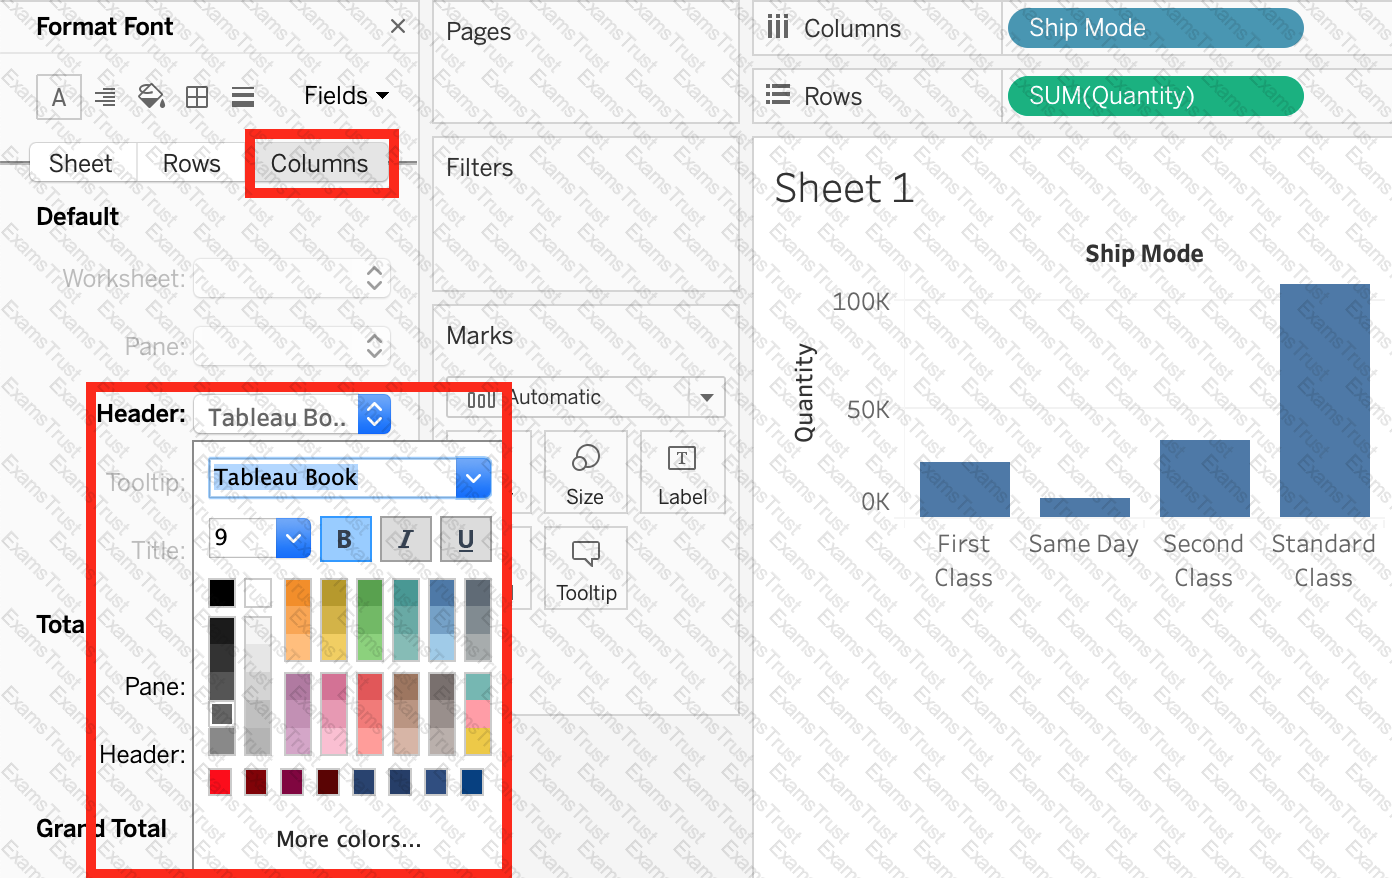
What should you use to apply bold text formatting to rows or columns independent of each other?
What is a Tableau story point?
Which of the following are valid way(s) to make either of Rows or Columns Bold without affecting the other?
Which of the following are FALSE about Joins?
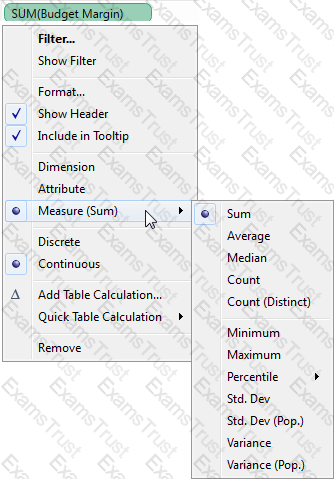
Which action describes the process for changing a measure so that it automatically aggregates an average instead of a sum?
What is the default behavior of Tableau when you add a measure to the view?
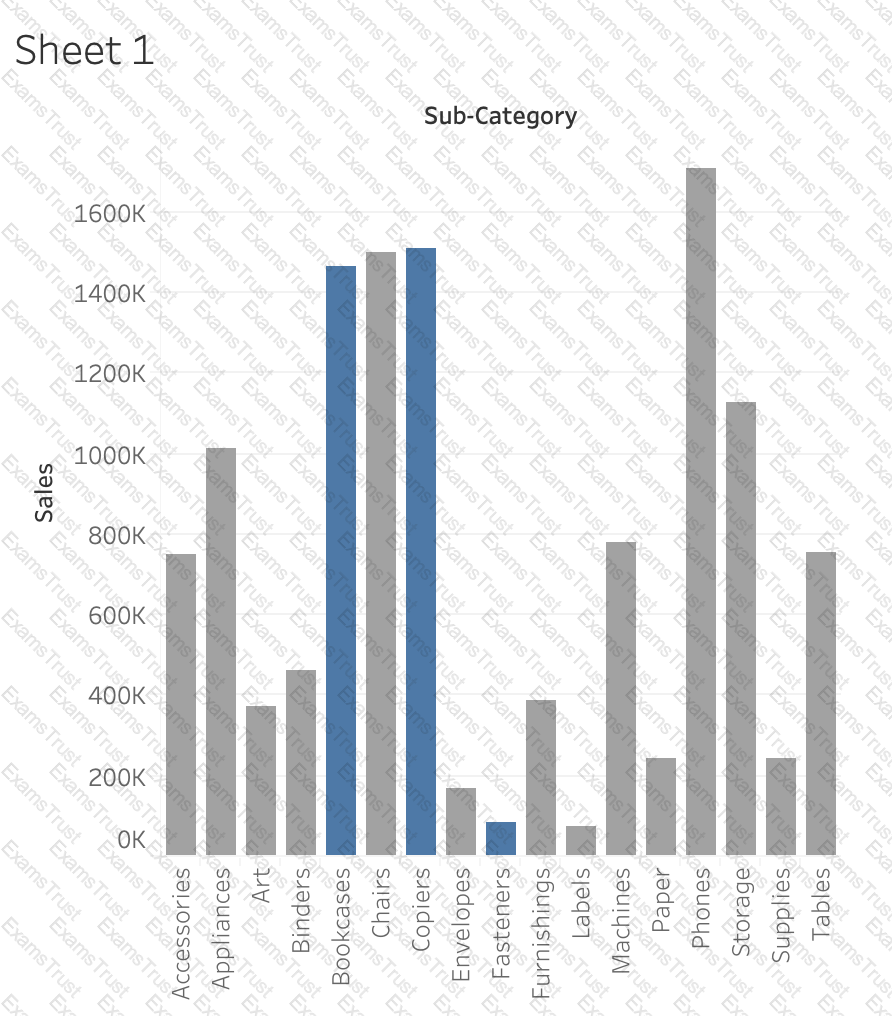
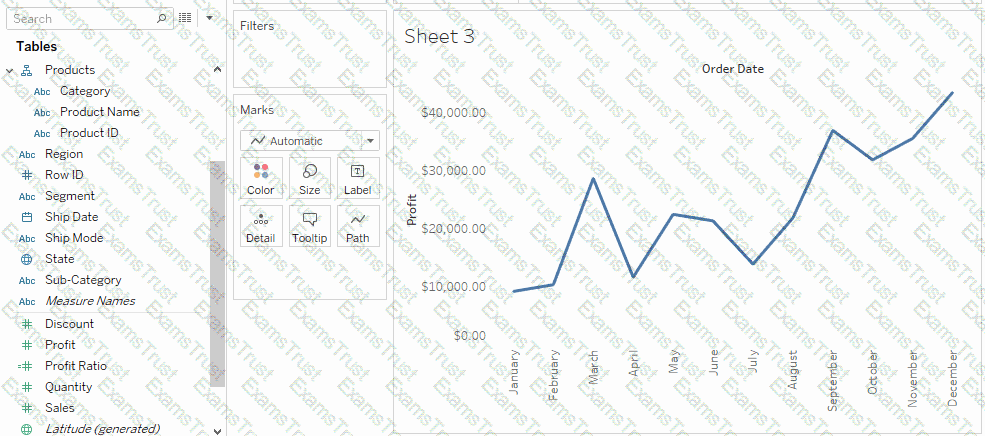
You have the following visualization.
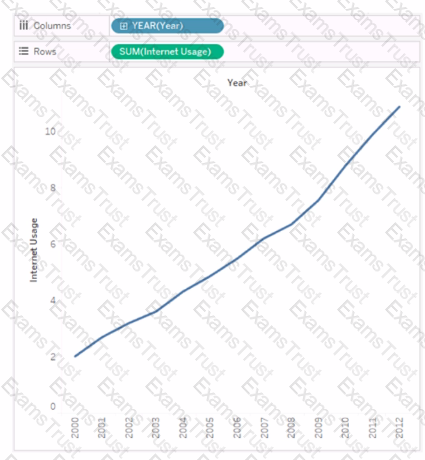
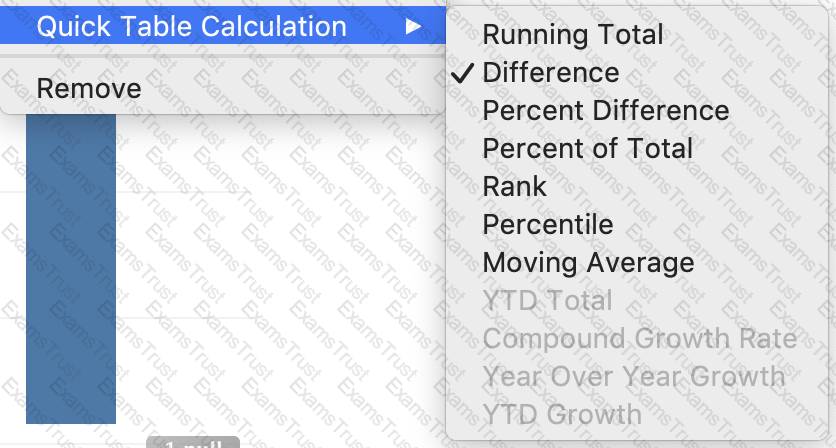
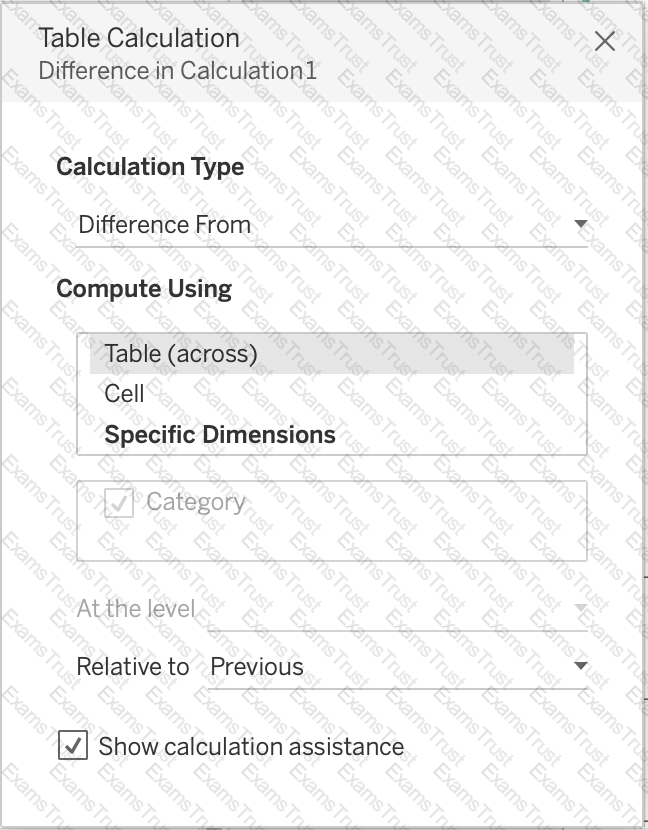
You need to show how Internet Usage values change from year-to-year as a percentage. Which quick table calculation should you apply to the Internet Usage field?
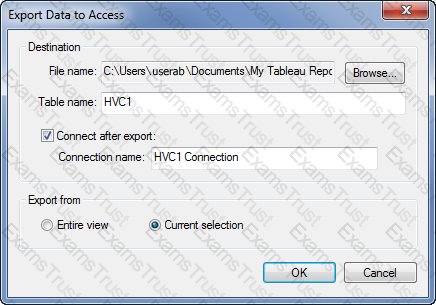
Which of the following are the options to export the data used to build the view / visualisations?
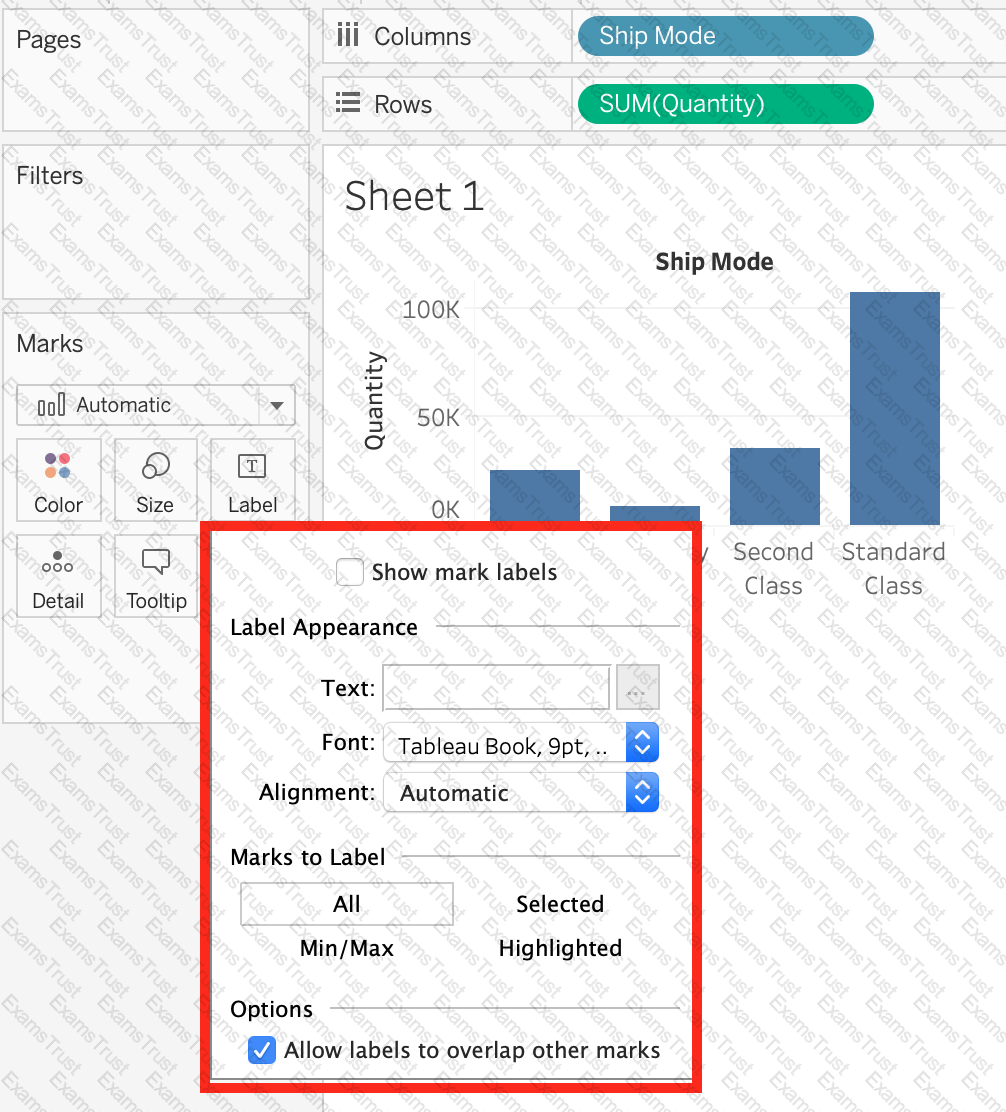
Which of the following are valid ways to Bold the Tooltip content in Tableau?
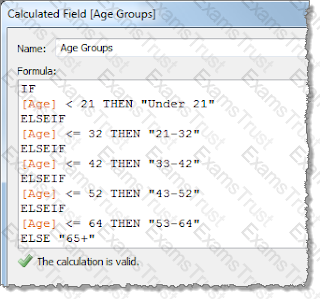
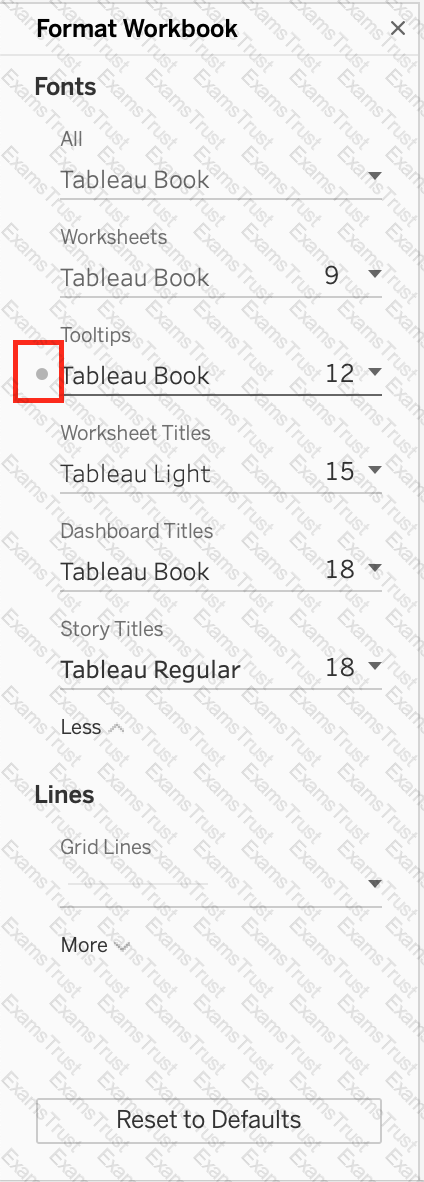
You want to provide additional information when hovering over a field in the Data pane as shown in the following exhibit.
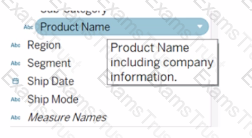
What should you configure for the field?
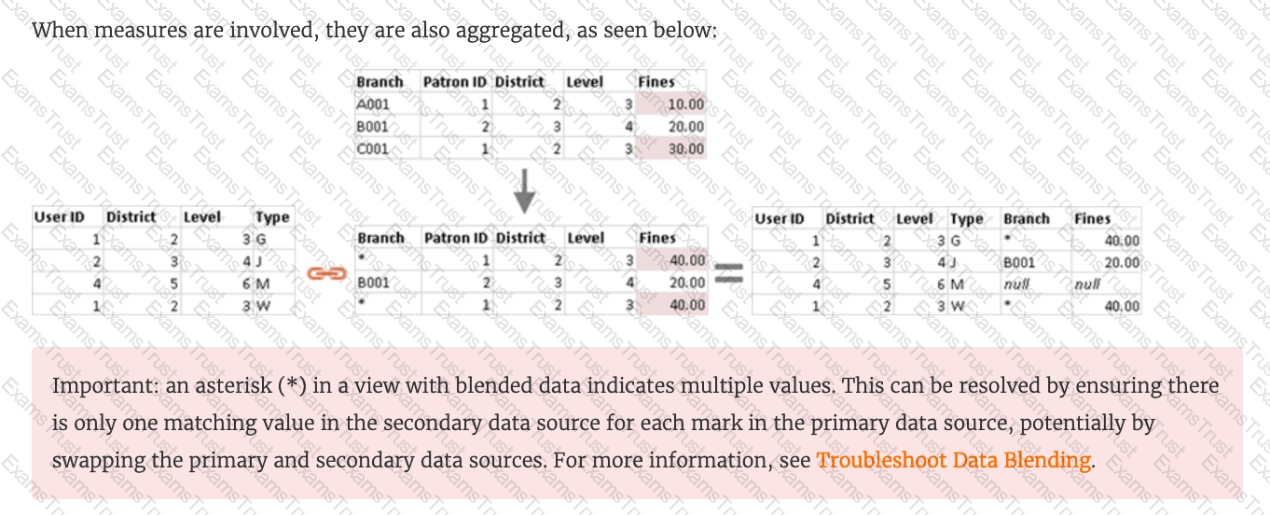
Data blending simulates a traditional _________________ Join
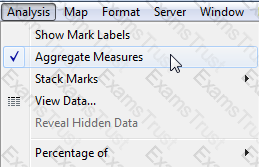
True or False: We can disaggregate the data, to see all of the marks in the view at the most detailed level of granularity
Dates in Tableau are typically treated as ______________
We can join a maximum of ______ tables in Tableau
Tableau auto-generates ____________ dimension(s) and _____________ measure(s) for us
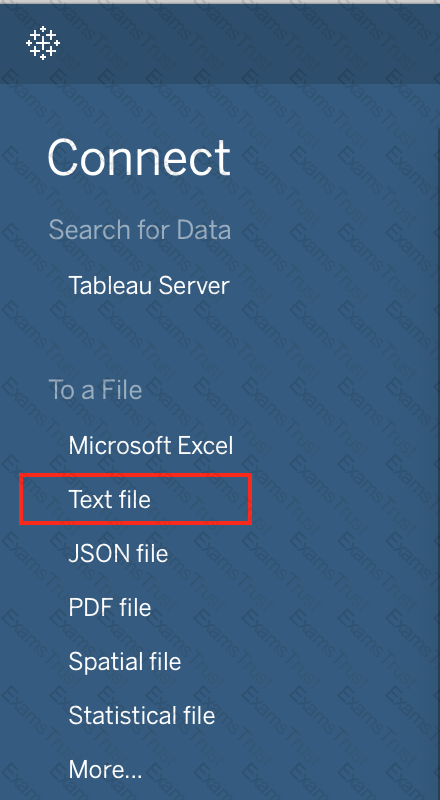
To connect Tableau to a CSV data source what type of connection should you use?
In Tree maps, the size begins with the largest rectangle on the ________________ and the smallest rectangle on the ________________.
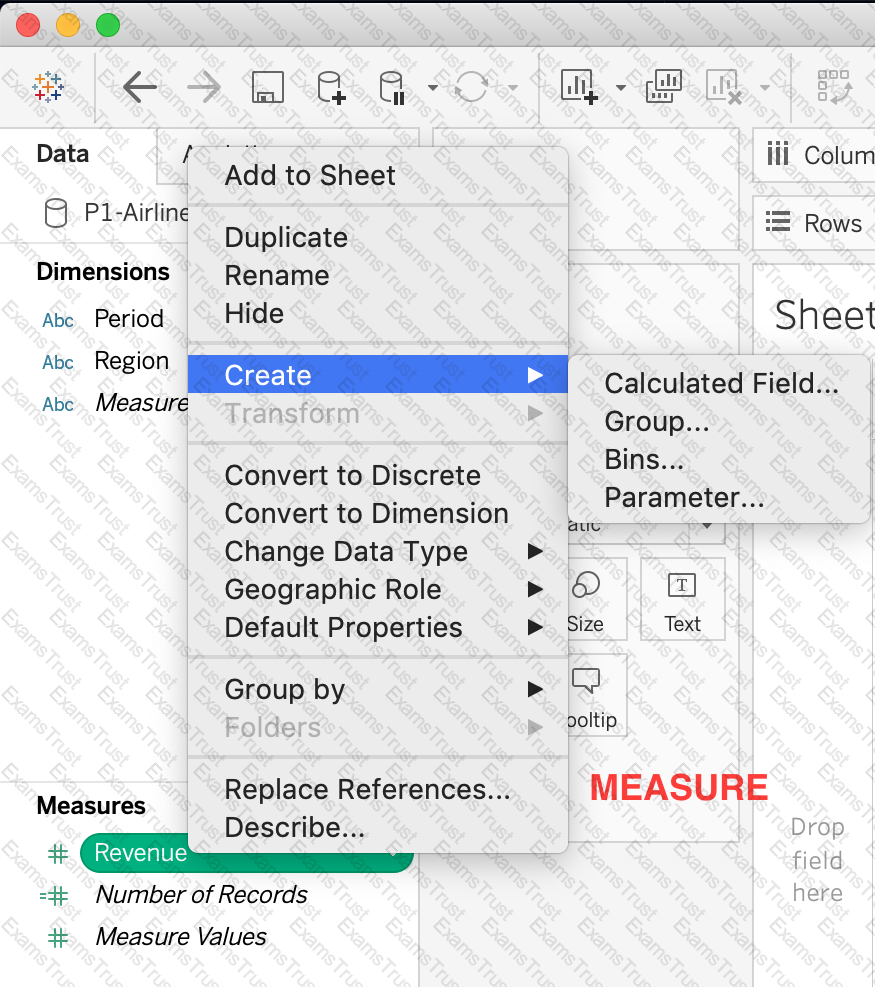
Which of the following is a valid way to create Sets in Tableau?
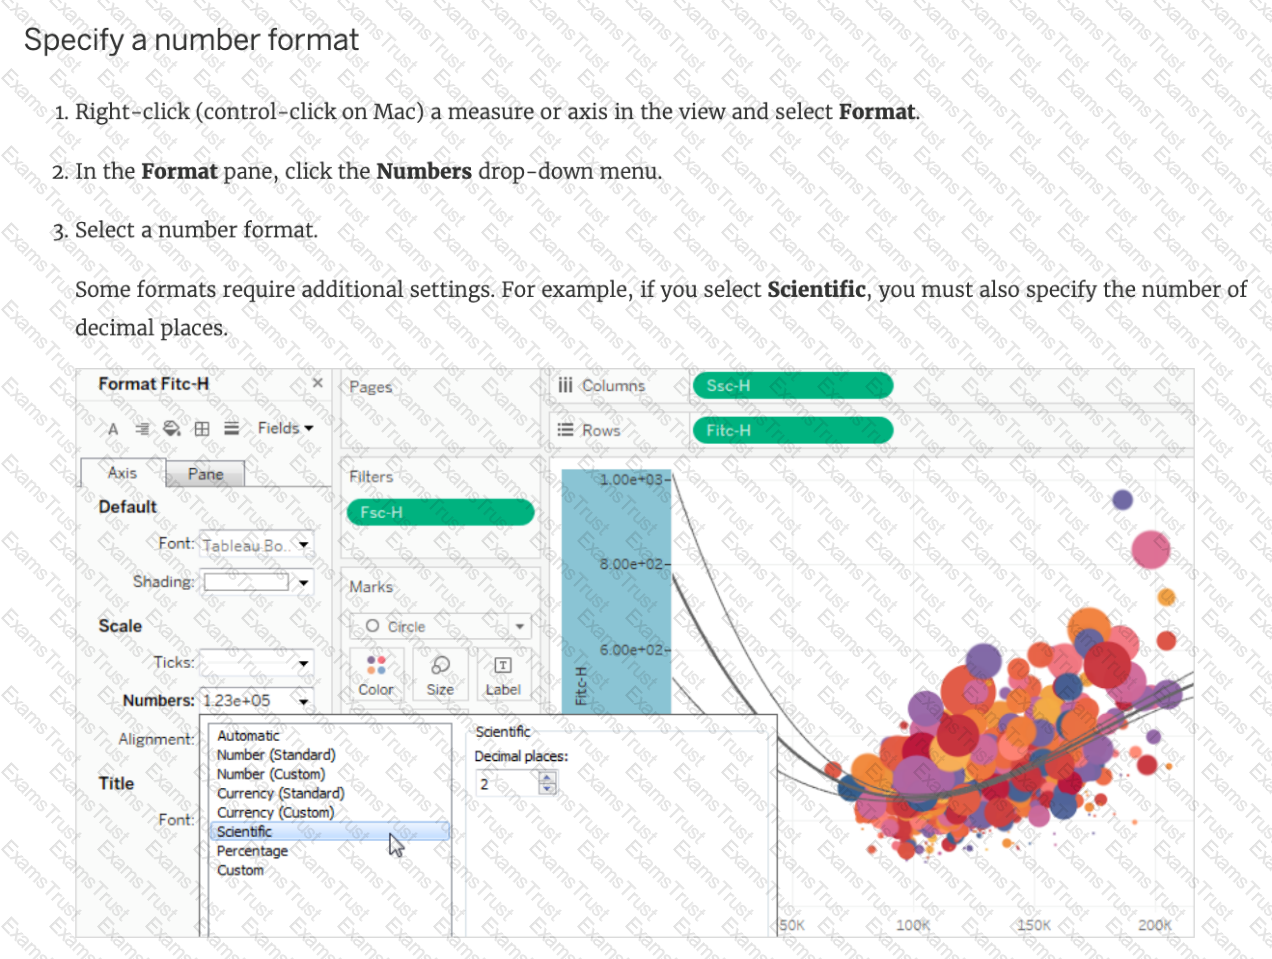
How can you format numbers in Tableau as currency?
True or False: When relating tables, the fields that define the relationships must have the same data type.
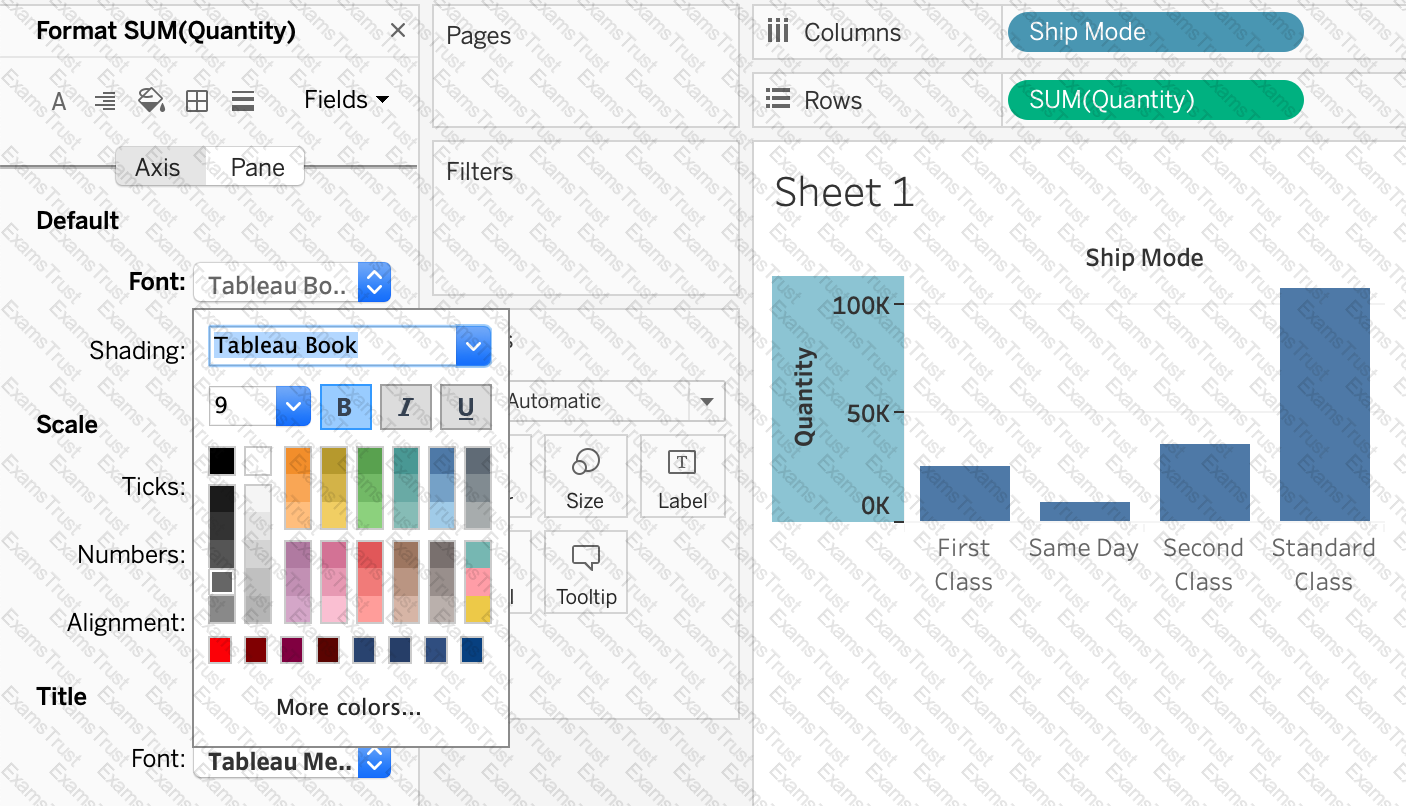
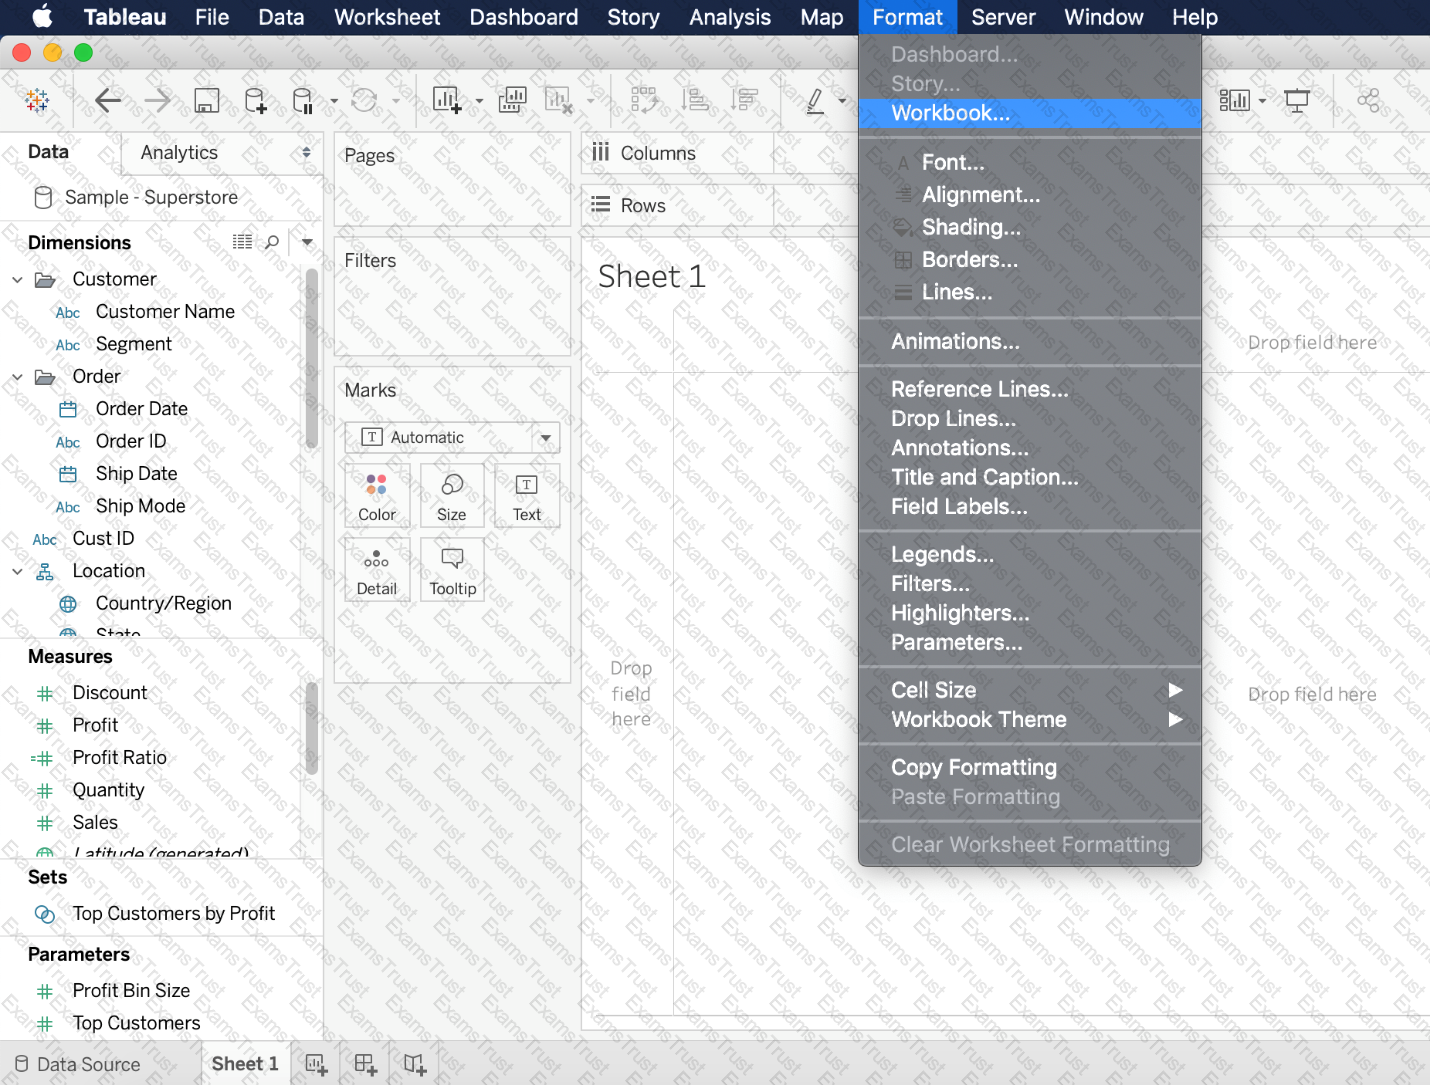
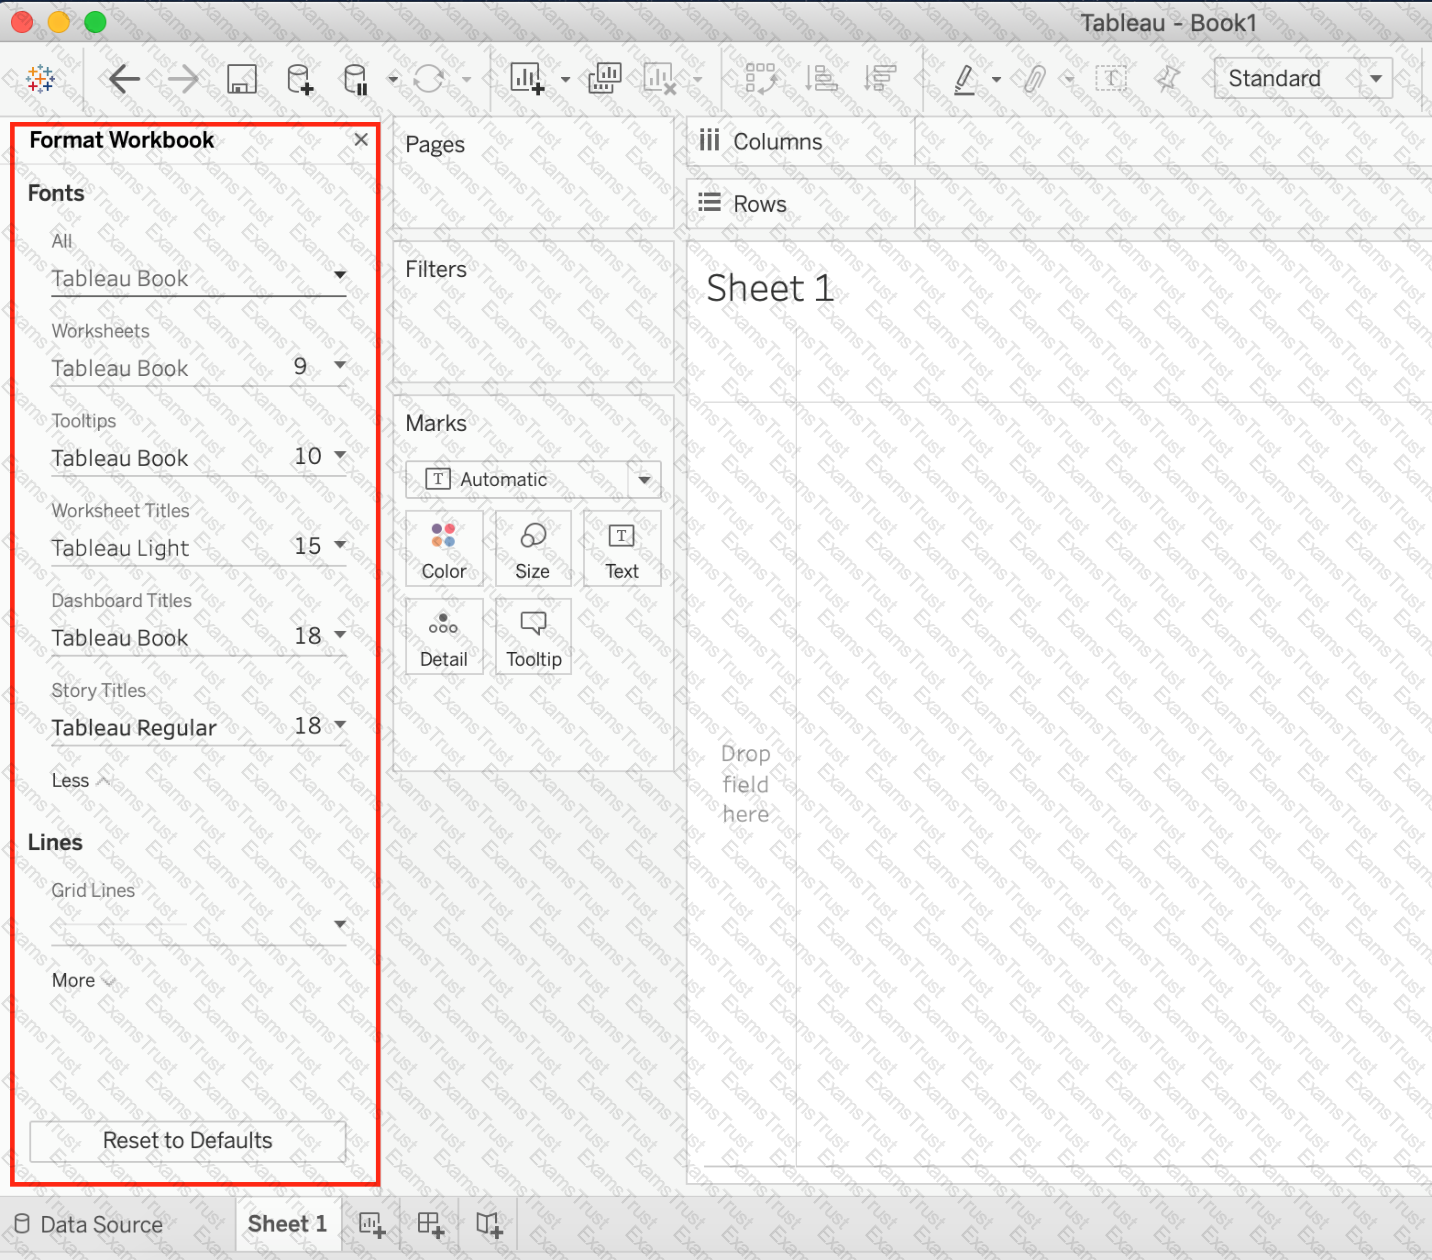
Which of the following describes the best way to change the formatting at a workbook level?
Which of the following are required to create a trend line?
Which of the following are valid ways of Grouping Data?
True or False : Bins can be created on dimensions
_____________ contains the visualisations, info needed to build the visualisations, and a copy of the data source.
You have the following visualization.
Which set type is created when you select the Create Set option?
 A picture containing application
Description automatically generated
A picture containing application
Description automatically generated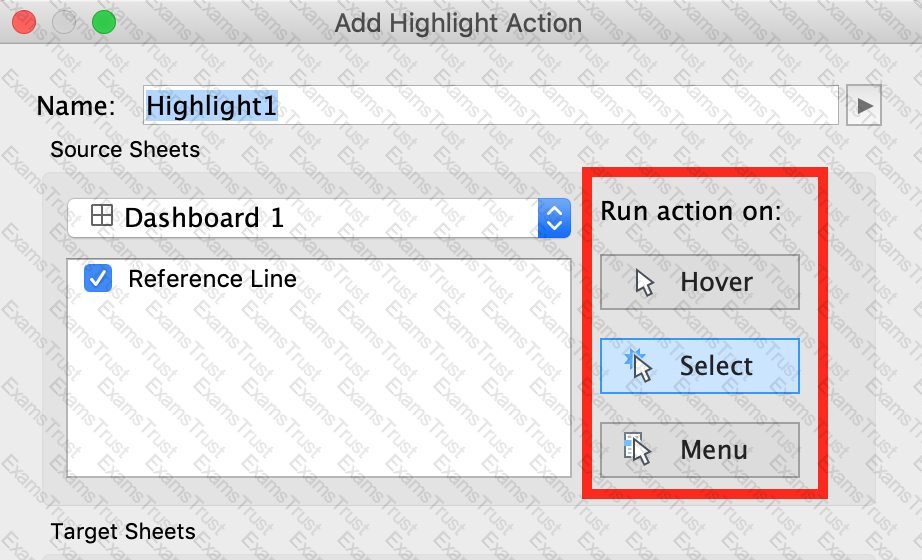
 ( Simple Scatter Plot)
 (Matrix of Scatter Plots)
 . You can quickly resolve the problem by replacing the field’s references.
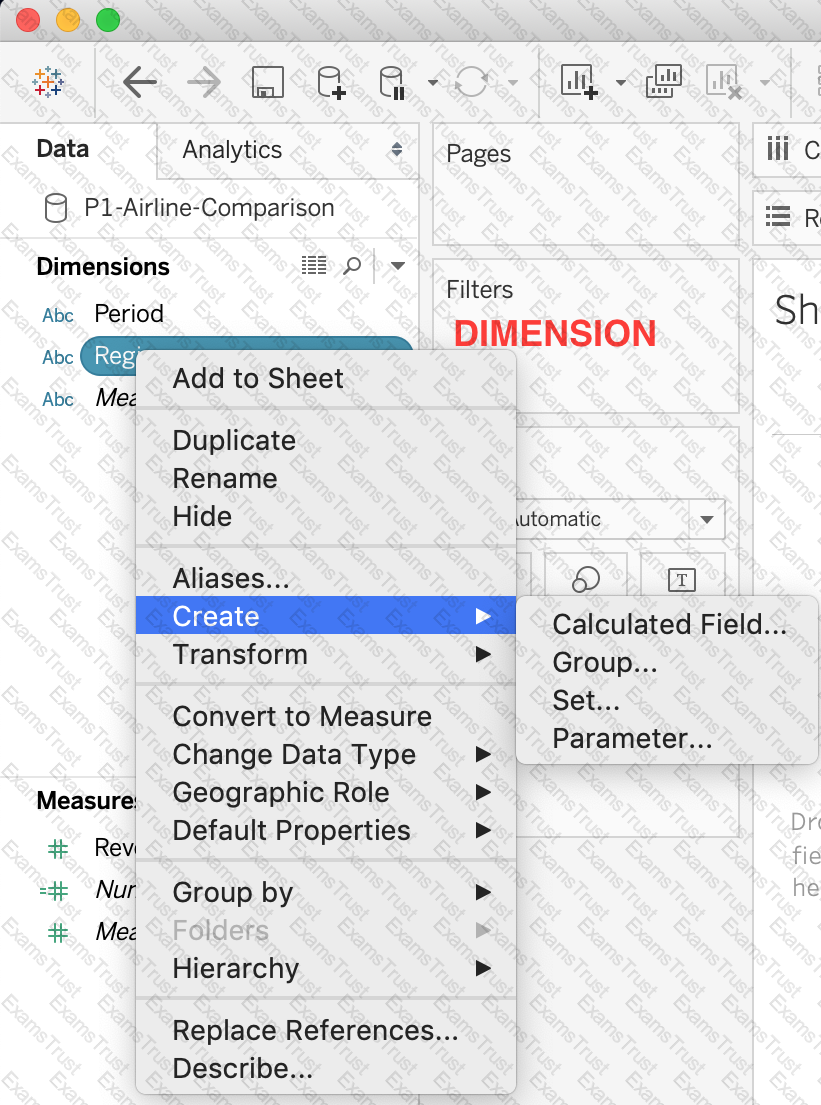


 Chart
Description automatically generated
Chart
Description automatically generated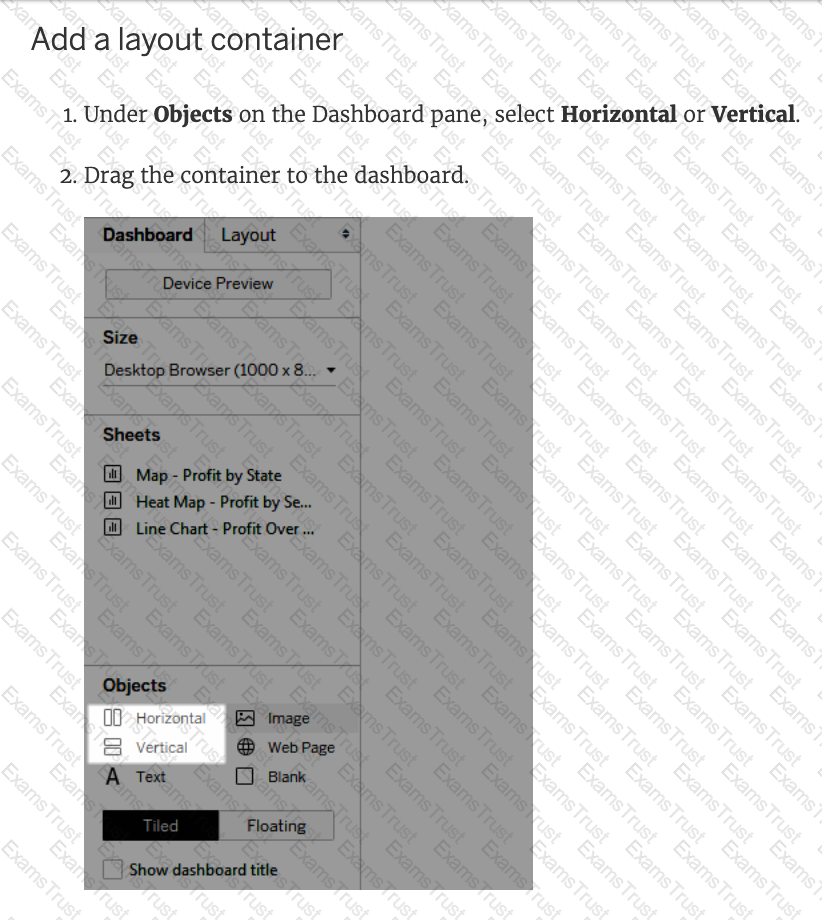
 c
c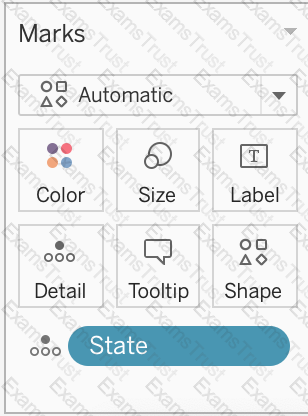
 Graphical user interface
Description automatically generated
Graphical user interface
Description automatically generated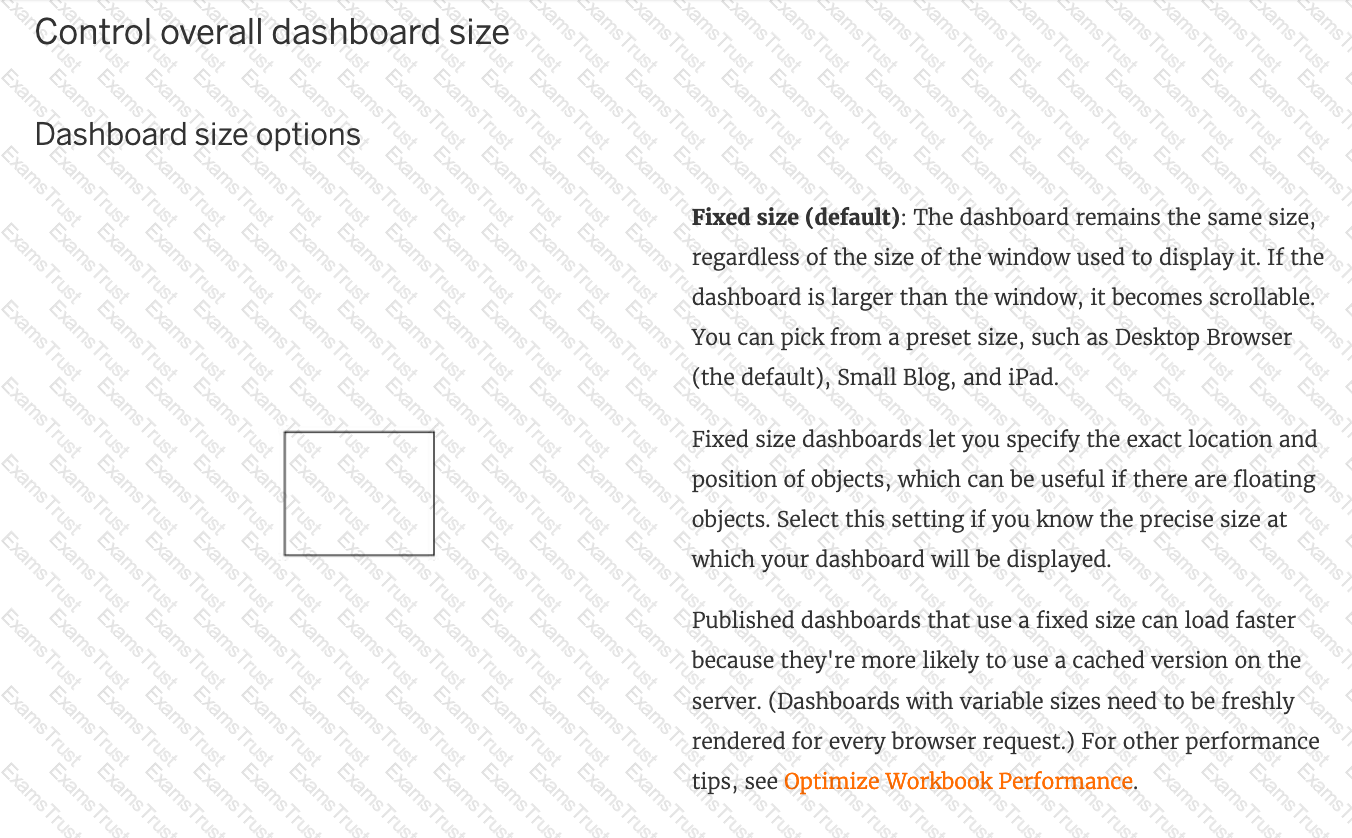
 Table
Description automatically generated
Table
Description automatically generated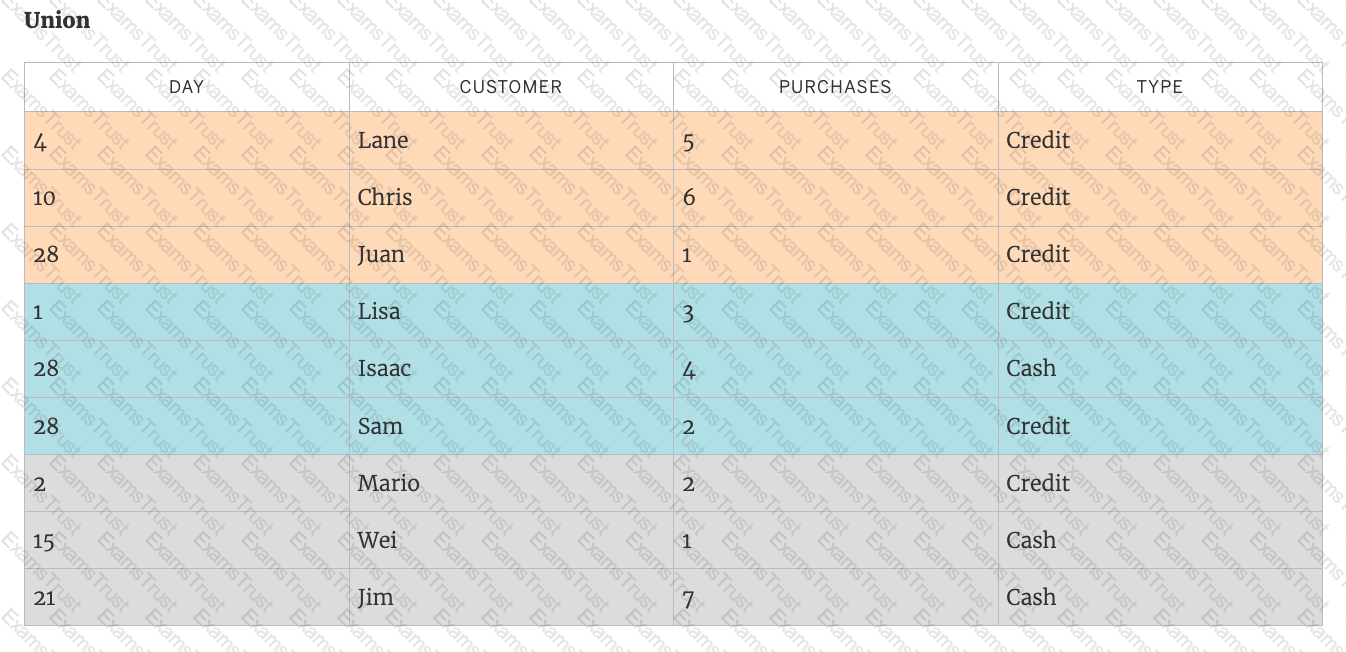 Table
Description automatically generated
Table
Description automatically generated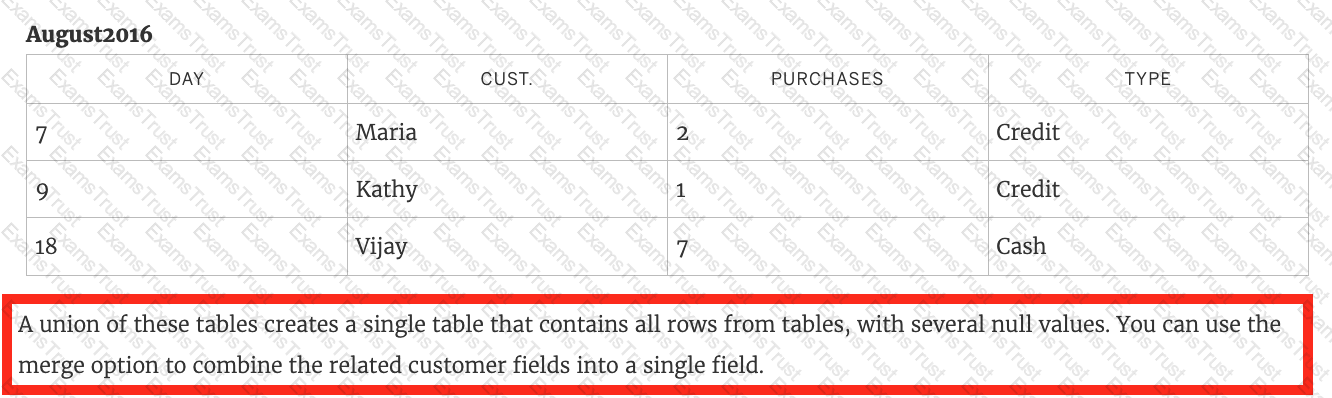 Table
Description automatically generated
Table
Description automatically generated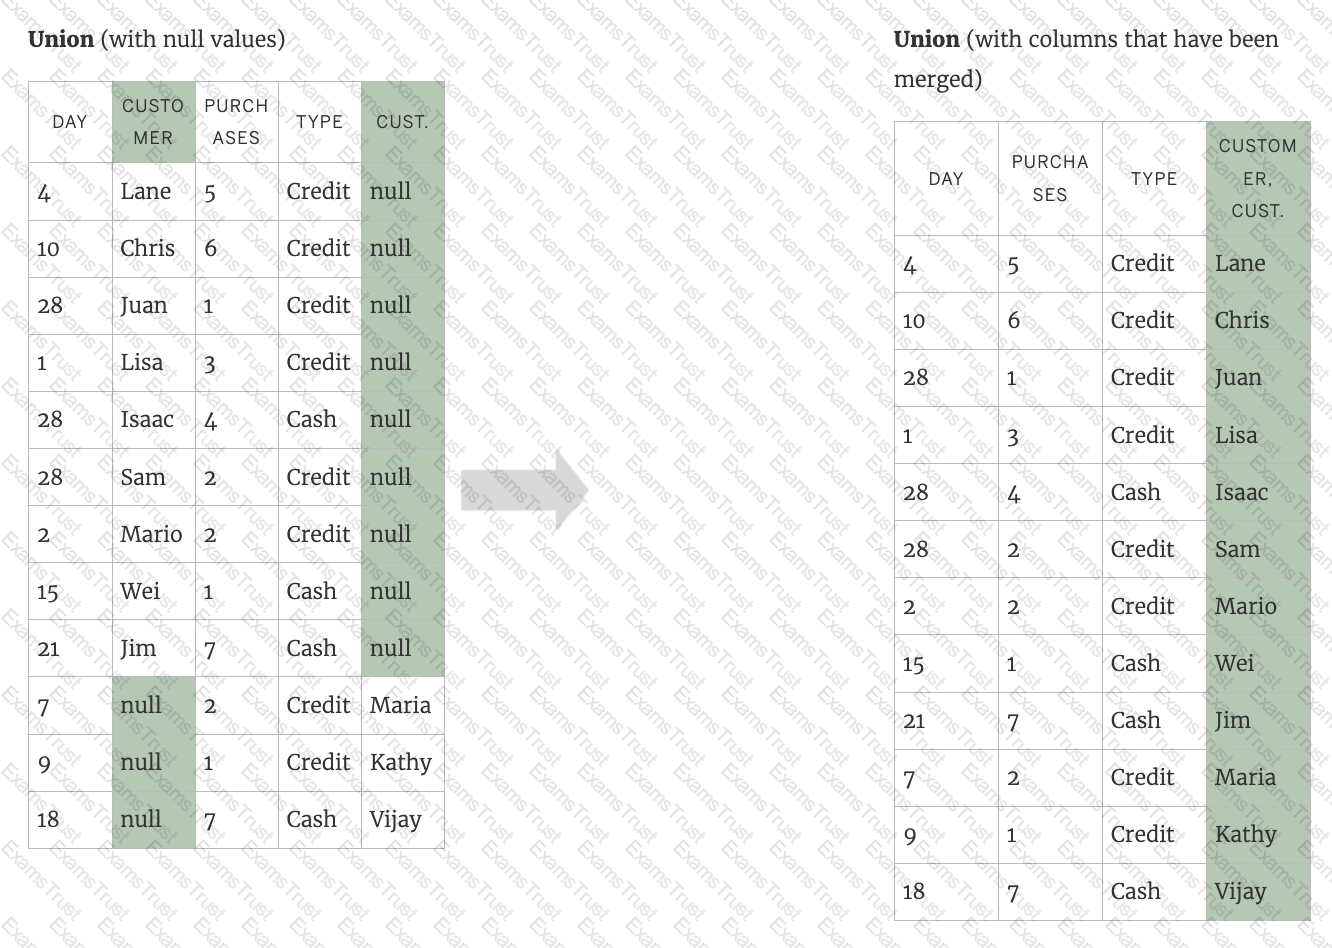 Table
Description automatically generated
Table
Description automatically generated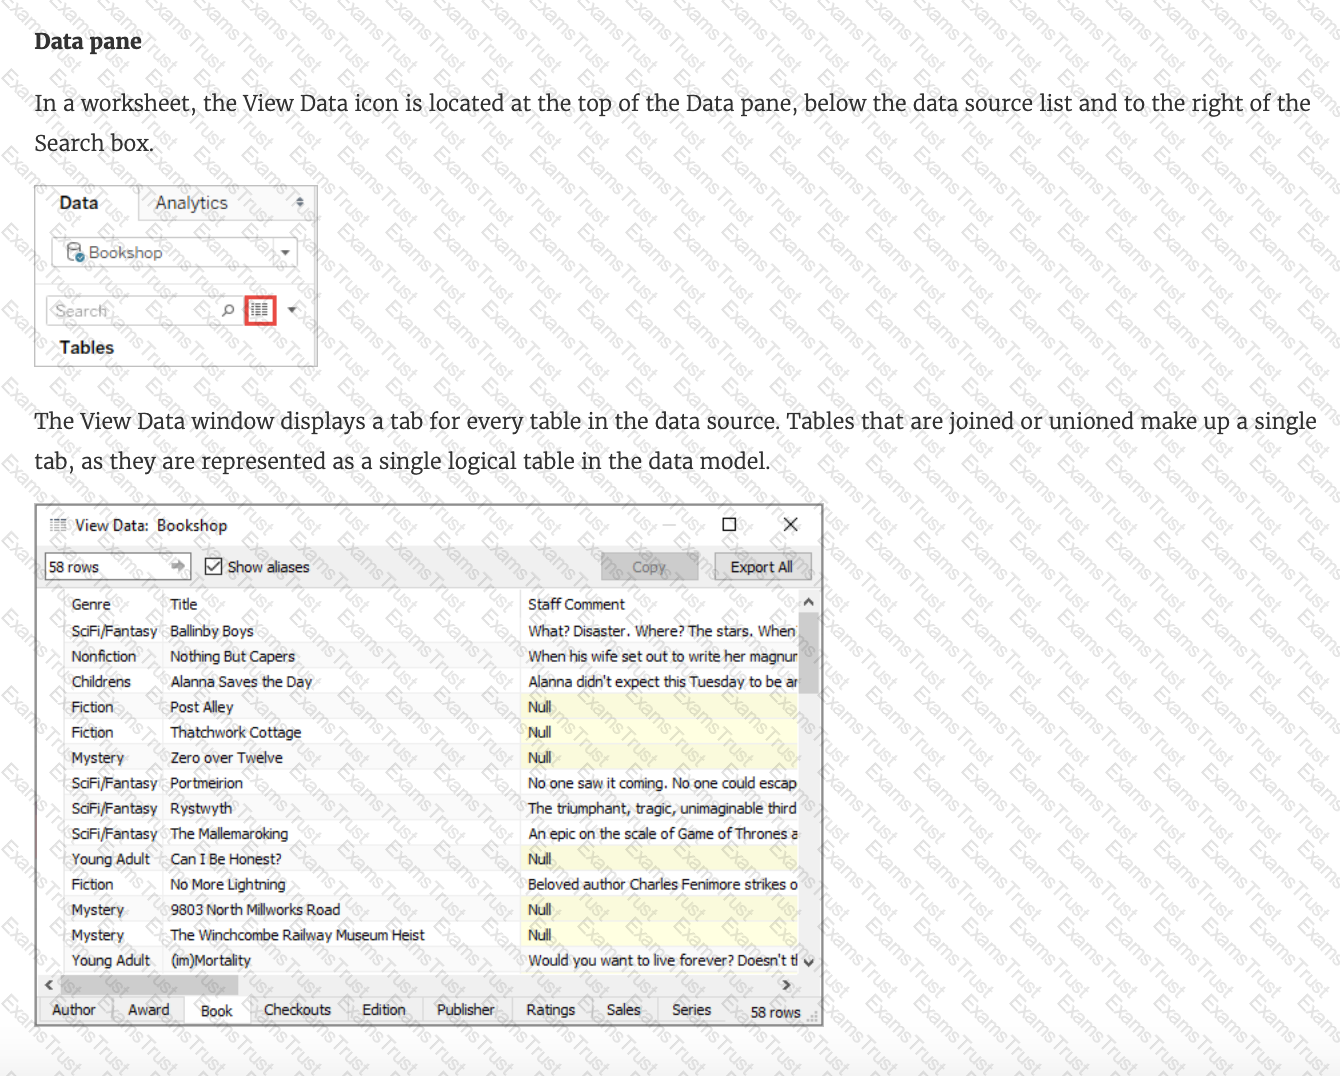
 Graphical user interface, chart, line chart
Description automatically generated
Graphical user interface, chart, line chart
Description automatically generated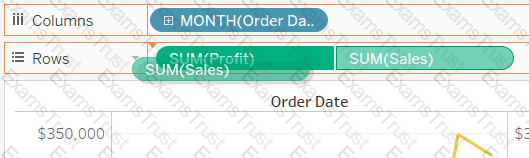 Graphical user interface, application
Description automatically generated
Graphical user interface, application
Description automatically generated
 Graphical user interface, text, application, email
Description automatically generated
Graphical user interface, text, application, email
Description automatically generated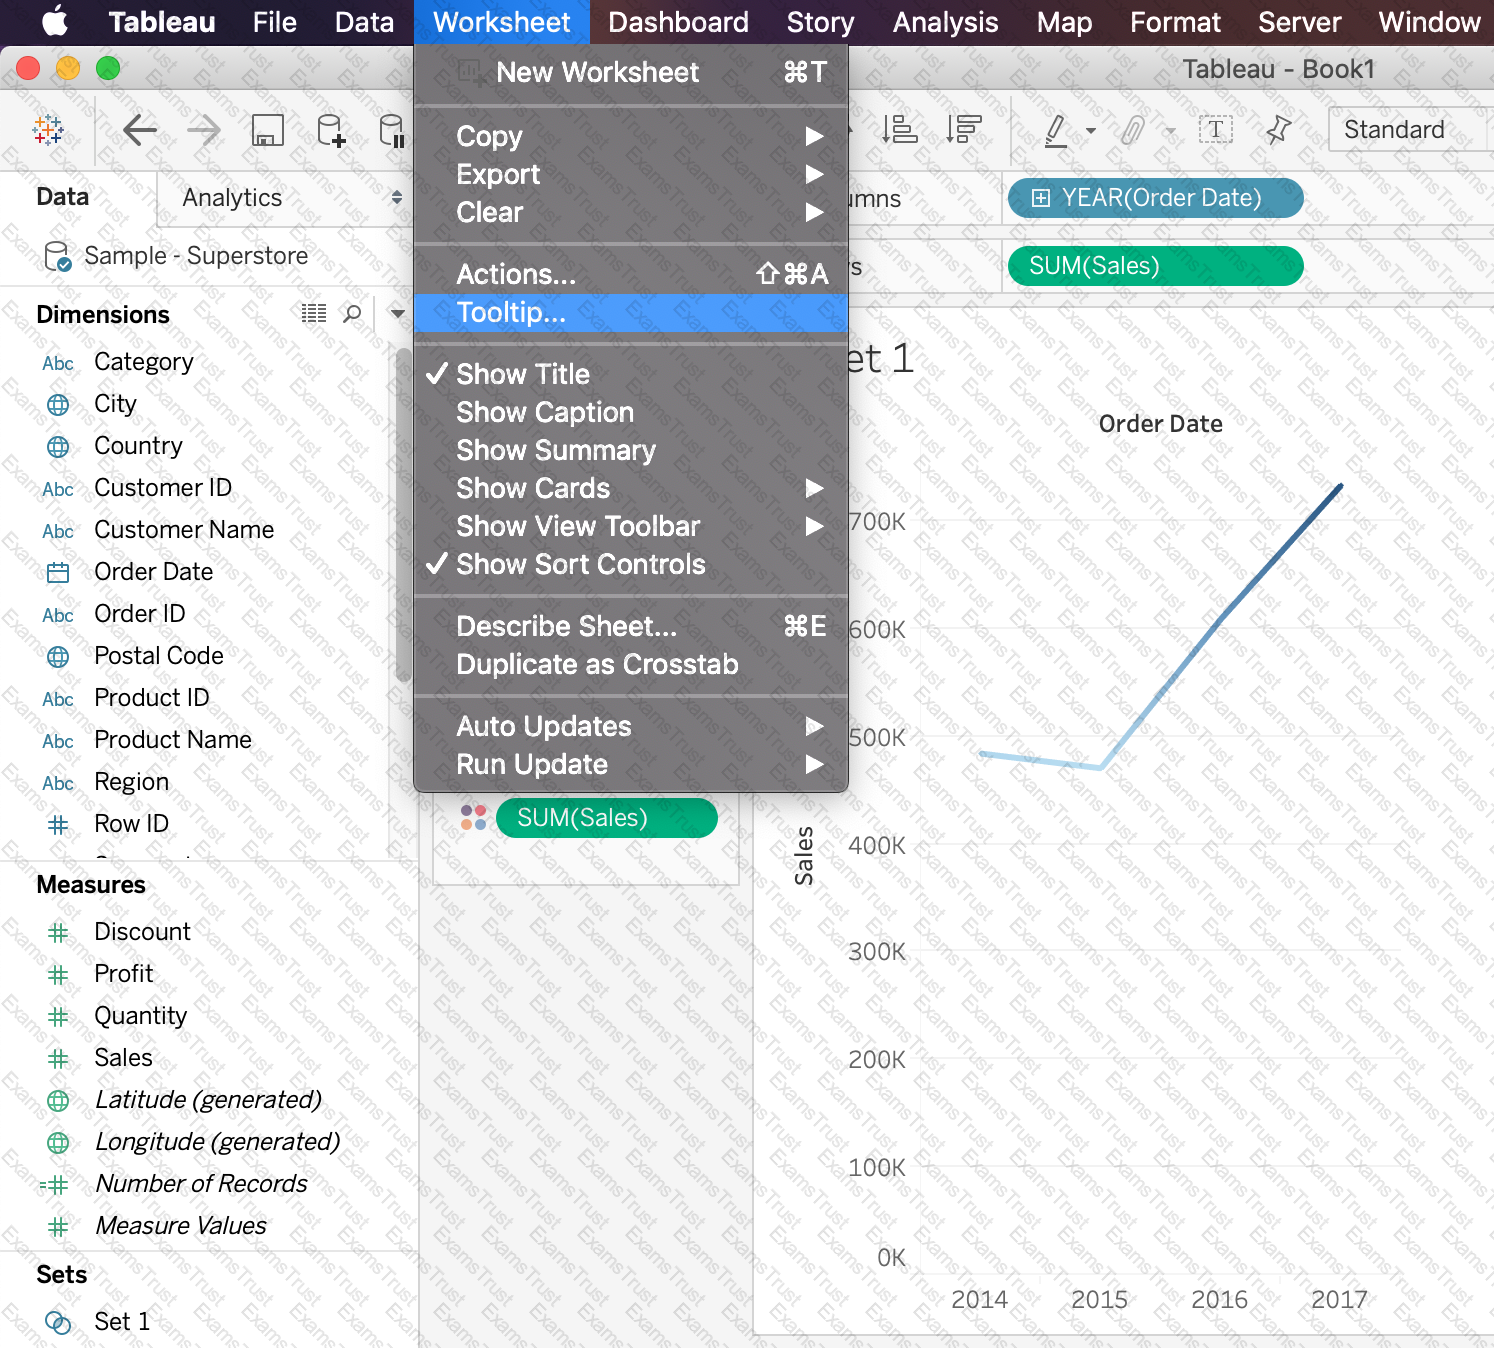 Graphical user interface
Description automatically generated
Graphical user interface
Description automatically generated Graphical user interface, application, Word
Description automatically generated
Graphical user interface, application, Word
Description automatically generated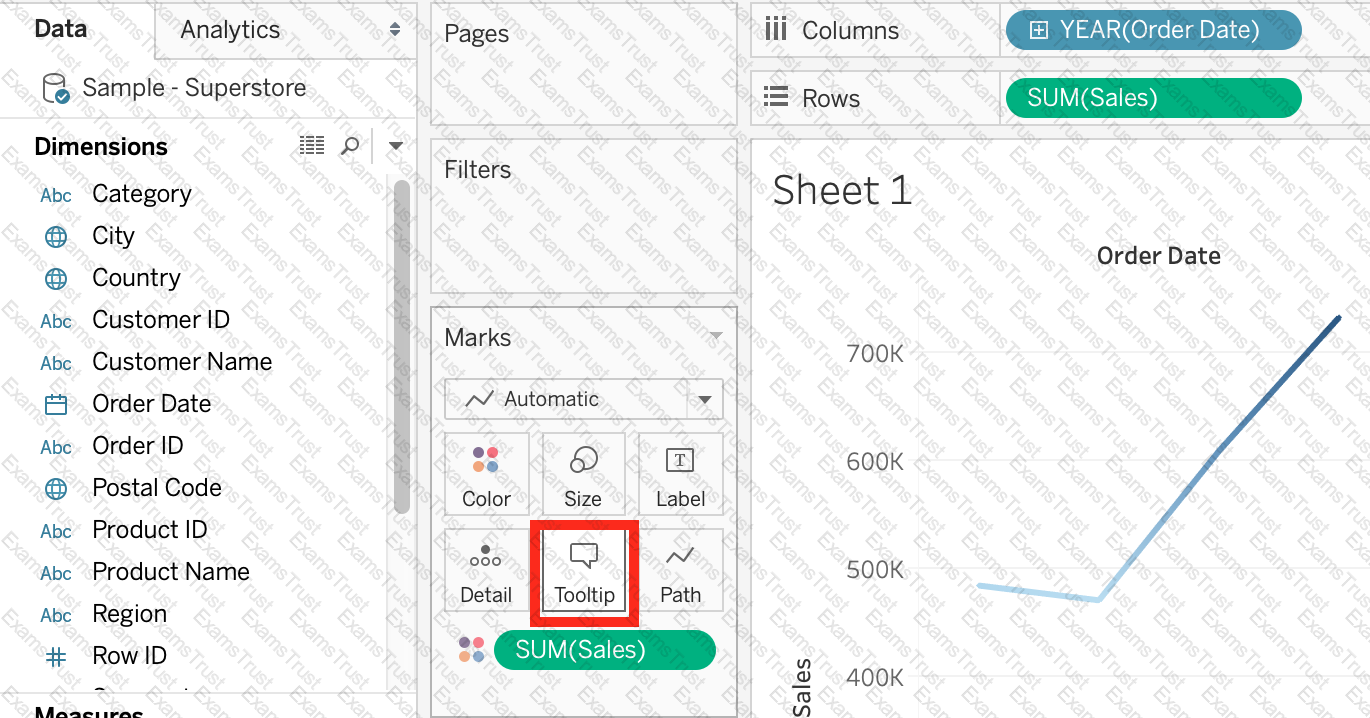 Graphical user interface, application
Description automatically generated
Graphical user interface, application
Description automatically generated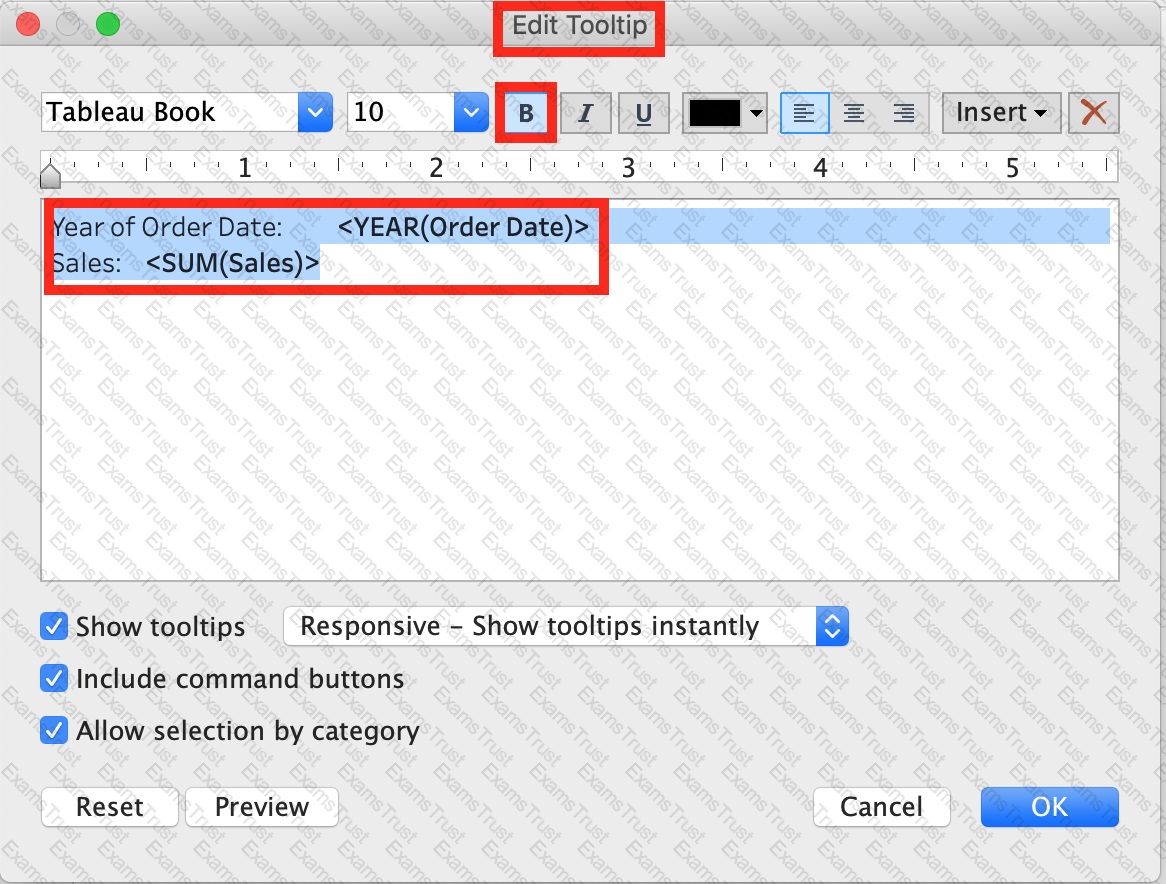 Graphical user interface, application, Word
Description automatically generated
Graphical user interface, application, Word
Description automatically generated A picture containing line chart
Description automatically generated
A picture containing line chart
Description automatically generated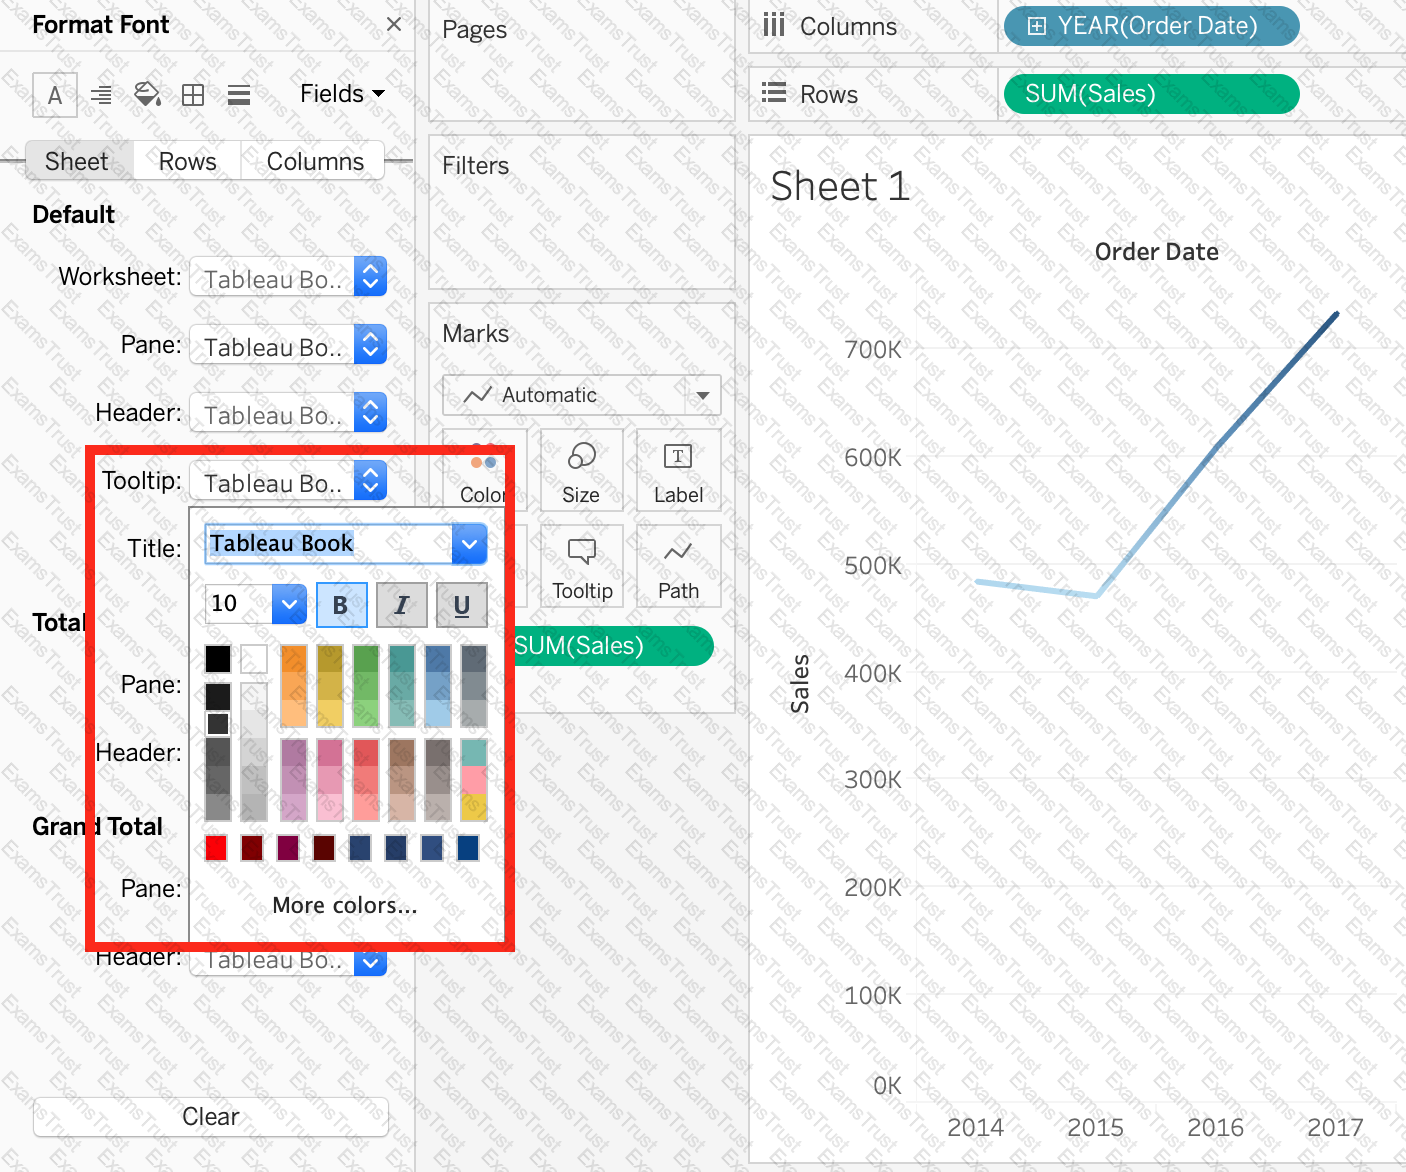 Graphical user interface
Description automatically generated
Graphical user interface
Description automatically generated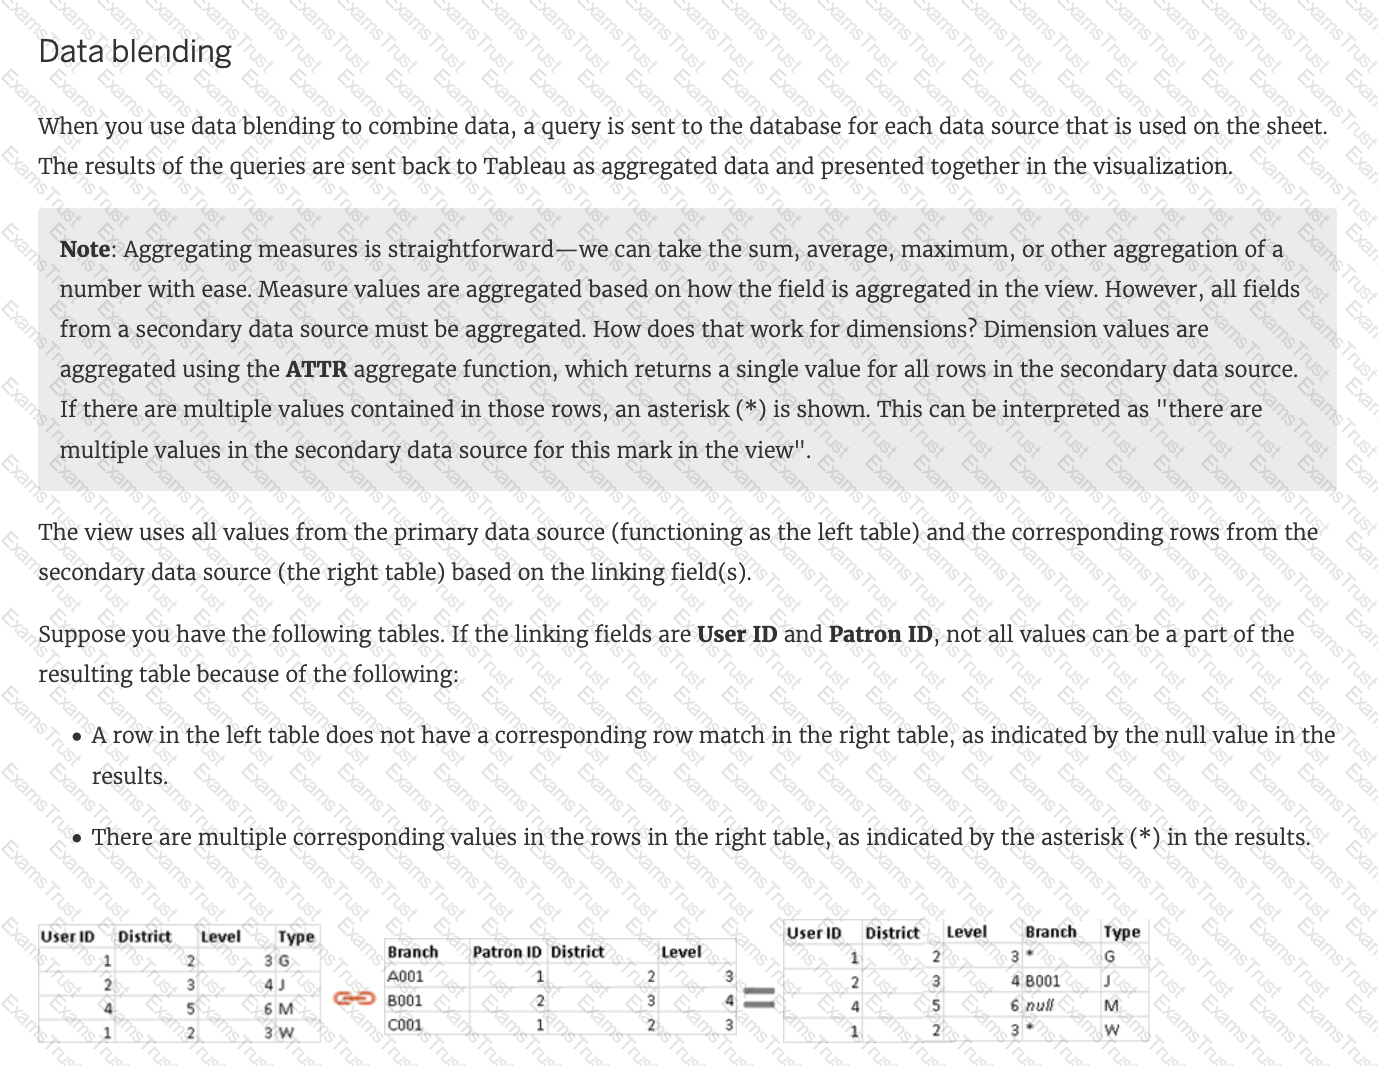
 Graphical user interface, application
Description automatically generated
Graphical user interface, application
Description automatically generated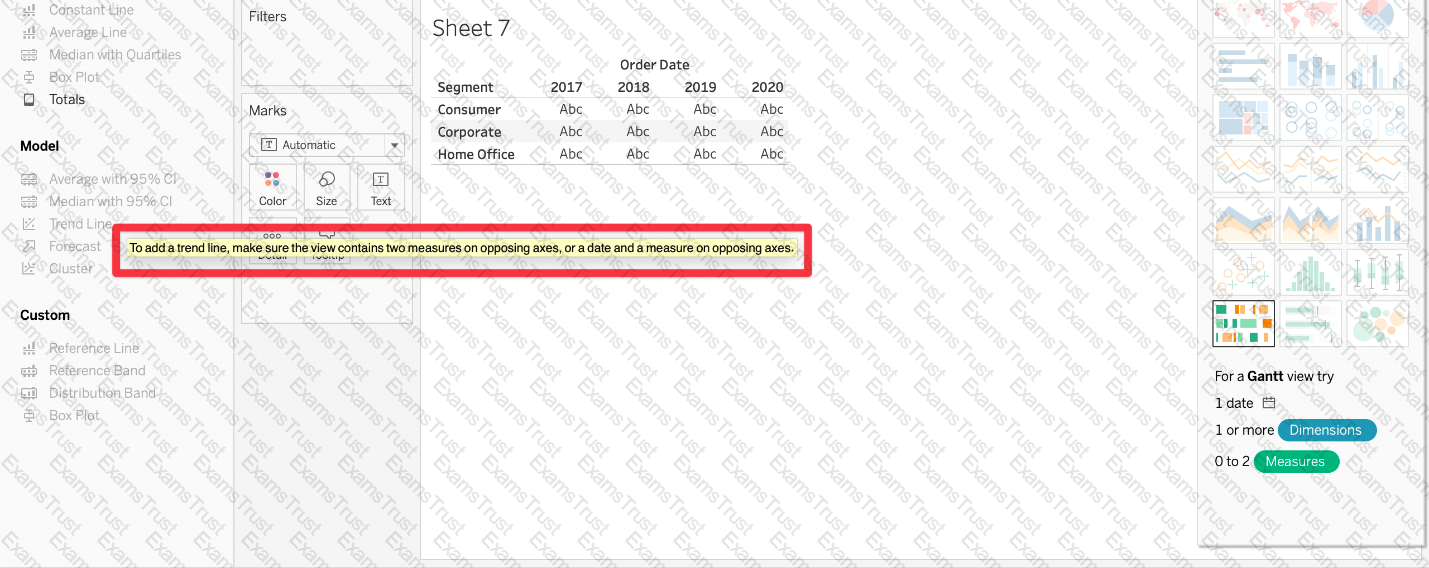 Graphical user interface, application
Description automatically generated
Graphical user interface, application
Description automatically generated