Use the following login credentials to sign in
to the virtual machine:
Username: Admin
Password:
The following information is for technical
support purposes only:
Lab Instance: 40201223
To access Tableau Help, you can open the
Help.pdf file on the desktop.
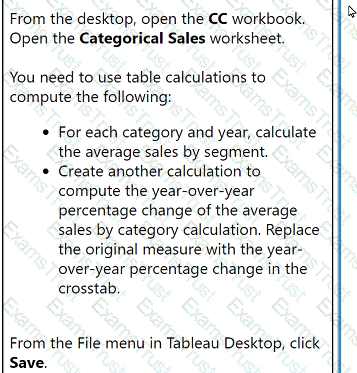
From the desktop, open the CC workbook.
Open the Categorical Sales worksheet.
You need to use table calculations to
compute the following:
. For each category and year, calculate
the average sales by segment.
. Create another calculation to
compute the year-over-year
percentage change of the average
sales by category calculation. Replace
the original measure with the year-
over-year percentage change in the
crosstab.
From the File menu in Tableau Desktop, click
Save.
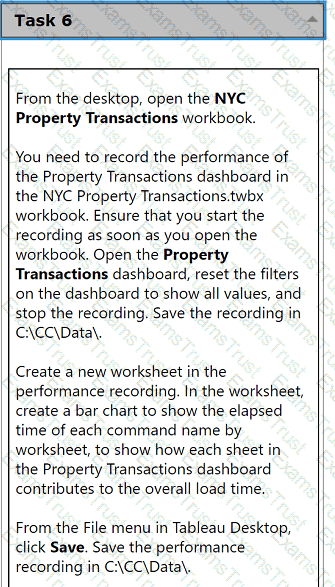
From the desktop, open the NYC
Property Transactions workbook.
You need to record the performance of
the Property Transactions dashboard in
the NYC Property Transactions.twbx
workbook. Ensure that you start the
recording as soon as you open the
workbook. Open the Property
Transactions dashboard, reset the filters
on the dashboard to show all values, and
stop the recording. Save the recording in
C:\CC\Data\.
Create a new worksheet in the
performance recording. In the worksheet,
create a bar chart to show the elapsed
time of each command name by
worksheet, to show how each sheet in
the Property Transactions dashboard
contributes to the overall load time.
From the File menu in Tableau Desktop,
click Save. Save the performance
recording in C:\CC\Data\.
From the desktop, open the CC workbook.
Open the City Pareto worksheet.
You need to complete the Pareto chart to show the percentage of sales compared to the percentage of cities. The chart must show references lines to visualize how the data compares to the Pareto principle.
From the File menu in Tableau Desktop, click Save.
From the desktop, open the CC workbook. Use the US Population Estimates data source.
You need to shape the data in US Population Estimates by using Tableau Desktop. The data must be formatted as shown in the following table.
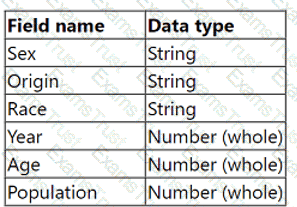
Open the Population worksheet. Enter the total number of records contained in the data set into the Total Records parameter.
From the File menu in Tableau Desktop, click Save.
From the desktop, open the CC workbook.
Open the Incremental worksheet.
You need to add a line to the chart that
shows the cumulative percentage of sales
contributed by each product to the
incremental sales.
From the File menu in Tableau Desktop, click
Save.
From the desktop, open the CC workbook.
Open the Manufacturers worksheet.
The Manufacturers worksheet is used to
analyze the quantity of items contributed by
each manufacturer.
You need to modify the Percent
Contribution calculated field to use a Level
of Detail (LOD) expression that calculates
the percentage contribution of each
manufacturer to the total quantity.
Enter the percentage for Newell to the
nearest hundredth of a percent into the
Newell % Contribution parameter.
From the File menu in Tableau Desktop, click
Save.
A client wants to see the average number of orders per customer per month, broken down by region. The client has created the following calculated field:
Orders per Customer: {FIXED [Customer ID]: COUNTD([Order ID])}
The client then creates a line chart that plots AVG(Orders per Customer) over MONTH(Order Date) by Region. The numbers shown by this chart are far higher
than the customer expects.
The client asks a consultant to rewrite the calculation so the result meets their expectation.
Which calculation should the consultant use?
A client is using the Tableau Content Migration Tool to move content from an old Tableau Server to a new Tableau Server.
Which content will need to be moved using a different tool or process?
A client notices that while creating calculated fields, occasionally the new fields are created as strings, integers, or Booleans. The client asks a consultant if
there is a performance difference among these three data types.
What should the consultant tell the customer?
A consultant creates a histogram that presents the distribution of profits across a client's customers. The labels on the bars show percent shares. The consultant
used a quick table calculation to create the labels.
Now, the client wants to limit the view to the bins that have at least a 15% share. The consultant creates a profit filter but it changes the percent labels.
Which approach should the consultant use to produce the desired result?
A Tableau consultant is tasked with choosing a method of setting up row-level security (RLS) entitlements with tables during a Tableau implementation. The consultant has received a set of roles from a client in one normalized table, and a set of entitlements from the client in another normalized table.
The consultant plans on using the deepest granularity method. However, when the consultant gains access to the final set of data, they discover duplicate values at the lowest level. Most of the regions in the client's dataset contain sub-regions named 'East' and 'West'. However, some regions have a 'Null' value for sub-region.

How should the consultant proceed?
A performance recording of a workbook shows that a query to an extracted data source is taking too long.
Which area should the consultant focus on optimizing if "Executing Query" is taking a long time?
A consultant plans a Tableau deployment for a client that uses Salesforce. The client wants users to automatically see Tableau views of regional sales filtered
by customer as soon as the users sign into Salesforce.
Which approach should the consultant use to deliver the final visualization?
A client has a published dashboard. They change the dashboard and then republish it. Now, users report that their web browser bookmarks to the dashboard
are broken.
What are two possible causes for this issue? Choose two.
Which technique should a Tableau consultant use to make visualizations faster?
Which technique should a Tableau consultant use to optimize workbook performance with a live data source?
A client has a data source that stores a time stamp for each time a user interacts with a product feature. They visualize 3 years of data at the daily level. As adoption has grown over the last 6 months, the dashboard performance has steadily decreased, despite connecting via a data extract that is set to refresh every hour.
A Tableau consultant needs to improve performance of the dashboard with the least impact to the visualization.
Which option meets these requirements without additional cost?
A client wants to see data for only the most recent day in the dataset that is updated intermittently. The solution should offer the best caching performance.
Which approach should the consultant use to produce the desired results?
A client's dashboard has two sections dedicated to their shops and warehouses shown when a viewer chooses either shops or warehouses with a parameter.
There are a few quick filters that apply to both, while others apply to only shops or only warehouses.
Currently, the quick filters are all shown at the left side of the dashboard. The client wants to hide all filters, but when shown, make it easy for the viewer to
find the quick filters that work for only shops or only warehouses.
Which solution should the consultant recommend that meets the client's needs and is most user-friendly?
A business analyst needs to create a view in Tableau Desktop that reports data from both Excel and MSSQL Server.
Which two features should the business analyst use to create the view? Choose two.