You need to minimize me size of the dataset. The solution must meet the report requirements What should you do?
Change lite OrderlD column in the Orders table to the text data type.
Filter out discontinued products while importing the Product table.
Remove the QuantityPerUnit column from the Products table
Group the Categories table by the CategorylD column.
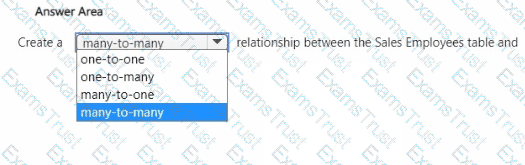
You need to create a relationship in the dataset for RLS.
What should you do? To answer, select the appropriate options in the answer area.
NOTE: Each correct selection is worth one point.
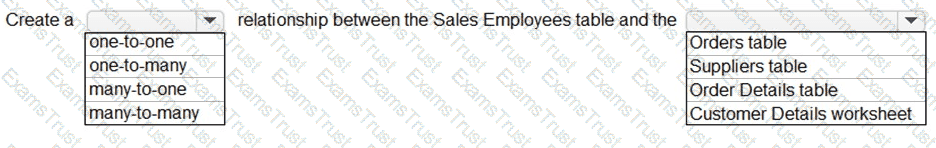
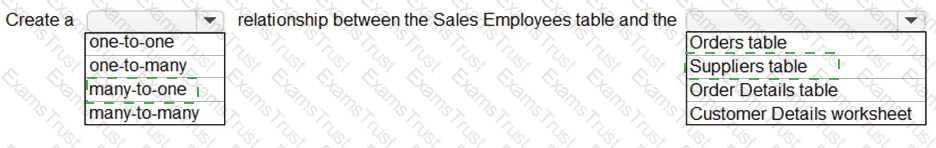
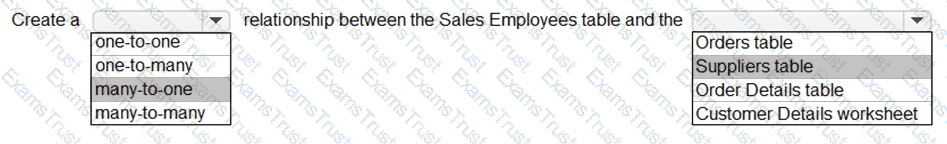
Box 1: many-to-one
Each employee in the Sales Employees table is assigned to one sales region. Multiple employees can be assigned to each region.
The Suppliers table has a Region column.
Box 2: Suppliers table
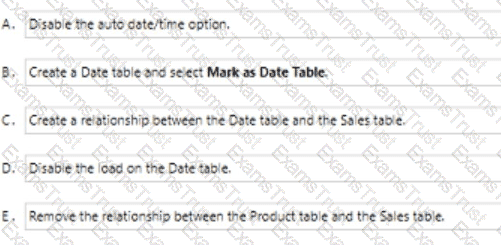
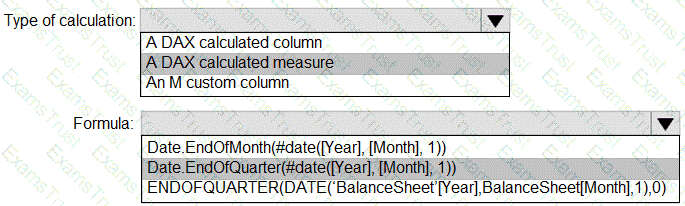
You need to design the data model to meet the report requirements.
What should you do in Power BI Desktop?
From Power Query, use a DAX expression to add columns to the Orders table to calculate the calendar quarter of the OrderDate column, the calendar month of the OrderDate column, the calendar quarter of the ShippedDate column, and the calendar month of the ShippedDate column.
From Power Query, add columns to the Orders table to calculate the calendar quarter and the calendar month of the OrderDate column.
From Power Bl Desktop, use the Auto date/time option when creating the reports.
From Power Query, add a date table. Create an active relationship to the OrderDate column in the Orders table and an inactive relationship to the ShippedDate column in the Orders table.
Use Power Query to calculate calendar quarter and calendar month.
Scenario:
A single dataset must support all three reports:
- The Top Customers report will show the top 20 customers based on the highest sales amounts in a selected order month or quarter, product category, and sales region.
- The Top Products report will show the top 20 products based on the highest sales amounts sold in a selected order month or quarter, sales region, and product category.
The data model must minimize the size of the dataset as much as possible, while meeting the report requirements and the technical requirements.
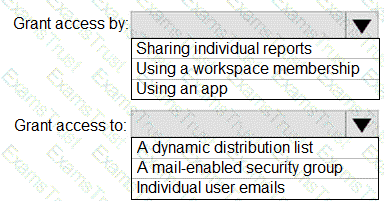
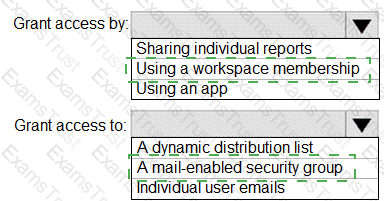
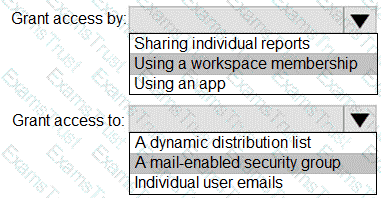
You need to configure access for the sales department users. The solution must me meet the security requirements. What should you do?
Add the sales department as a member of the reports workspace
Add the Azure Active Directory group of the sales department as an Admin of the reports workspace.
Distribute an app to the users in the Azure Active Directory group of the sales department.
Share each report to the Azure Active Directory group of the sales department.
You need to minimize the size of the semantic model. The solution must meet the report requirements.
What should you do?
Filter out discontinued products while importing the Products table.
Group the Categories table by the CategorylD column.
Change the OrderlD column in the Orders table to the Text data type.
Remove the QuantityPerUnit column from the Products table.
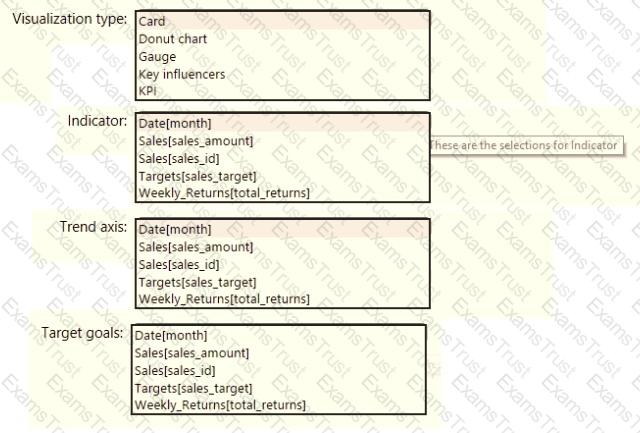
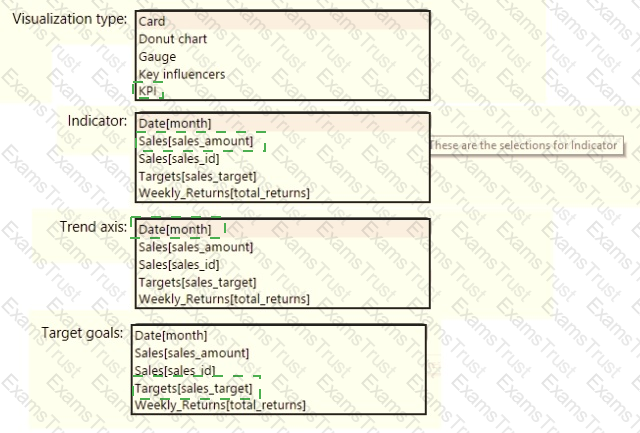
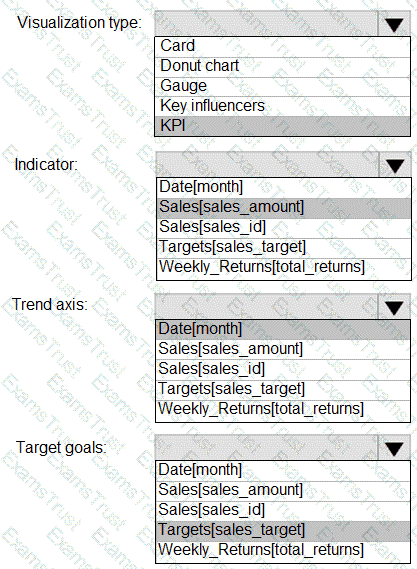
You need to create the On-Time Shipping report. The report must include a visualization that shows the percentage of late orders.
Which type of visualization should you create?
bar chart
scatterplot
pie chart
Scenario: The On-Time Shipping report will show the following metrics for a selected shipping month or quarter:
The percentage of orders that were shipped late by country and shipping region
Customers that had multiple late shipments during the last quarter
Note: Bar and column charts are some of the most widely used visualization charts in Power BI. They can be used for one or multiple categories. Both these chart types represent data with rectangular bars, where the size of the bar is proportional to the magnitude of data values.
The difference between the two is that if the rectangles are stacked horizontally, it is called a bar chart. If the rectangles are vertically aligned, it is called a column chart.
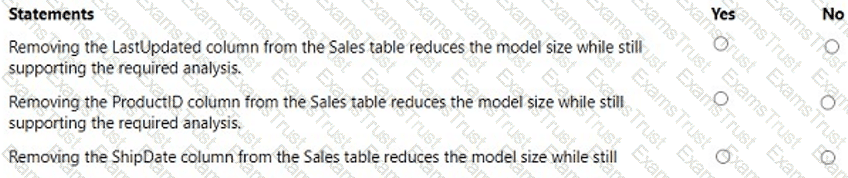
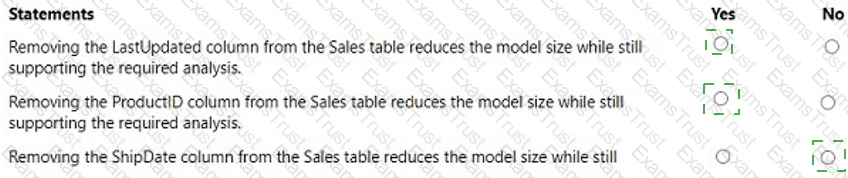
You need to design the data model and the relationships for the Customer Details worksheet and the Orders table by using Power BI. The solution must meet the report requirements.
For each of the following statement, select Yes if the statement is true, Otherwise, select No.
NOTE: Each correct selection is worth one point.


You need to create the dataset. Which dataset mode should you use?
DirectQuery
Import
Live connection
Composite
Composite Model means now you can have a model, that very large tables of that are coming from the DirectQuery connection, without the need for importing, and small tables to be imported to be accessible quickly.
You use Power Query to import two tables named Order Header and Order Details from an Azure SQL database. The Order Header table relates to the Order Details table by using a column named Order ID in each table.
You need to combine the tables into a single query that contains the unique columns of each table.
What should you select in Power Query Editor?
Merge queries
Append queries
Combine files
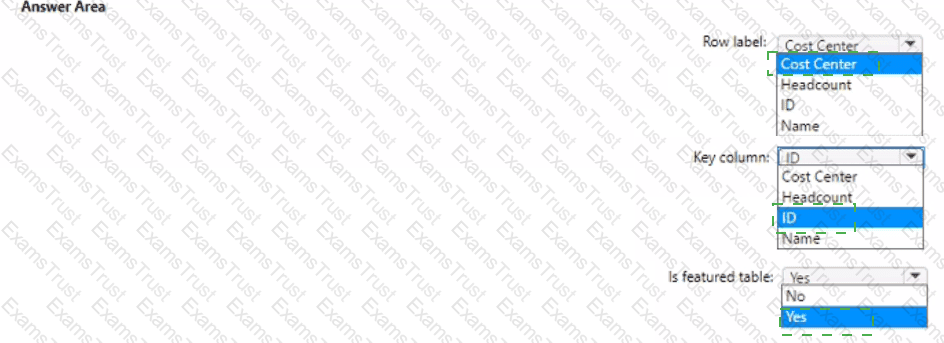
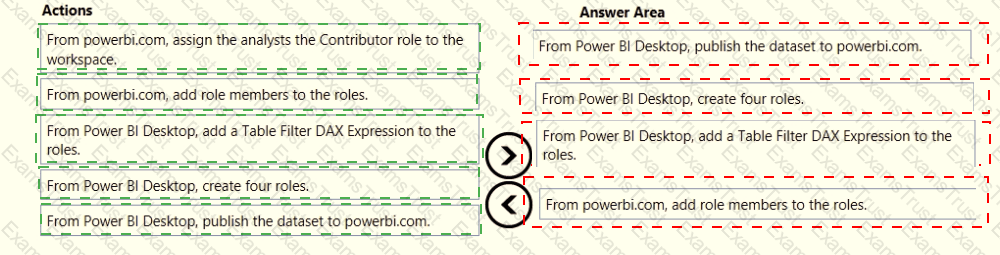
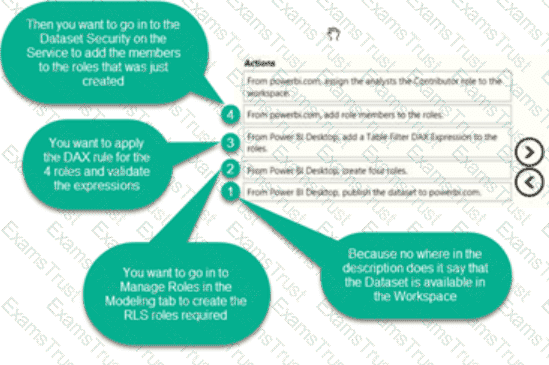
You need to create a solution to meet the notification requirements of the warehouse shipping department.
What should you do? To answer, select the appropriate options in the answer area.
NOTE: Each correct select is worth one point:


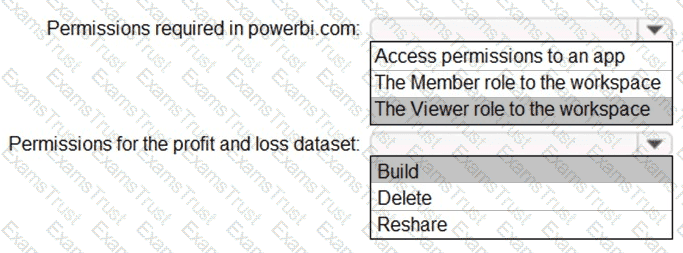
You need to create the Top Customers report.
Which type of filter should you use, and at which level should you apply the filter? To answer, select the appropriate options in the answer area.
NOTE: Each correct selection is worth one point.
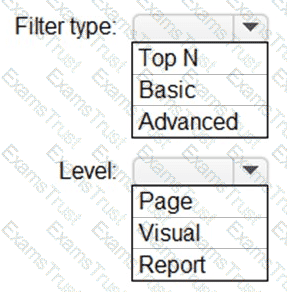
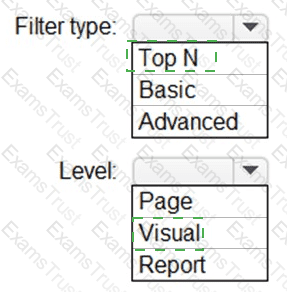
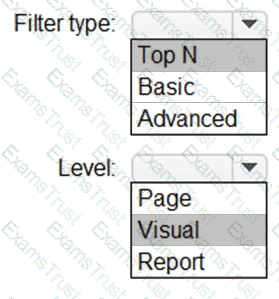
Box 1: Top N
Scenario: The Top Customers report will show the top 20 customers based on the highest sales amounts in a selected order month or quarter, product category, and sales region.
Once you drag to SKU to Visual level filter you should get Top N option
Note: The two most common filter types: automatic and manual.
Then there are more advanced filters.
Box 2: Visual
Once you drag to SKU to Visual level filter you should get Top N option.
You need to create the semantic model.
Which storage mode should you use for the tables in the semantic model?
live connection
Dual
Import
DirectQuery
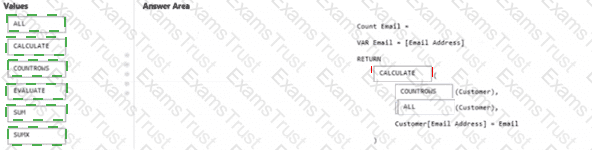
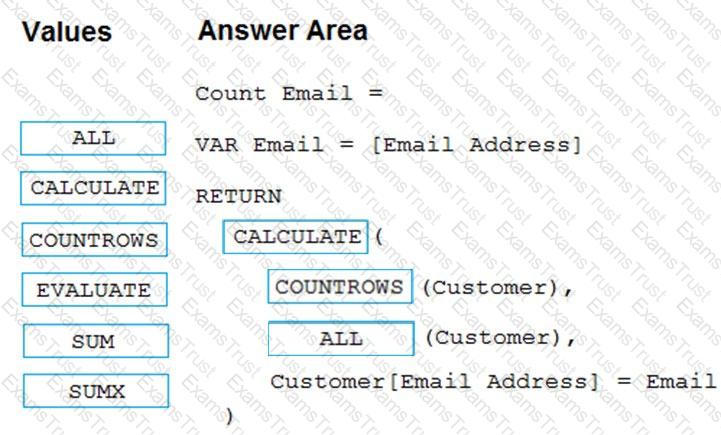
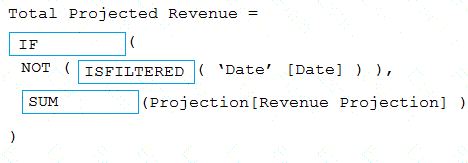
You need to create a measure that will return the percentage of late orders.
How should you complete the DAX expression? To answer, select the appropriate options in the answer area.
NOTE: Each correct selection is worth one point.
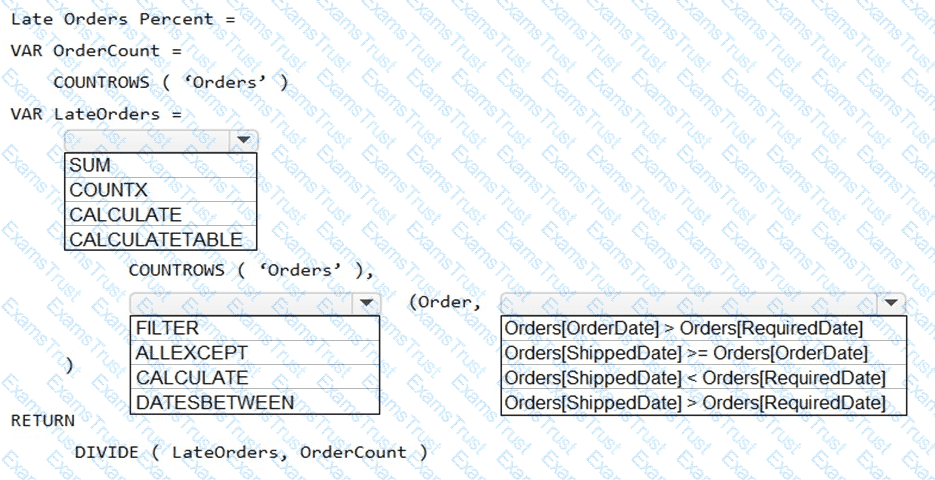
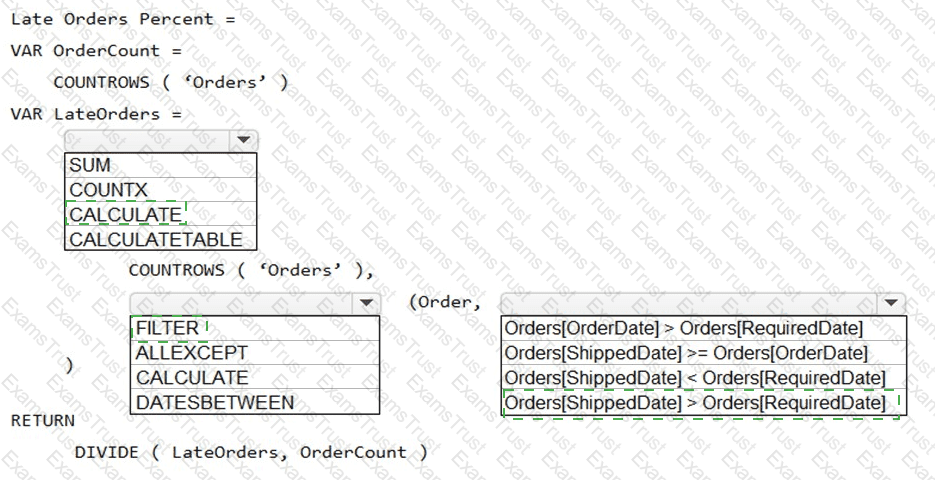
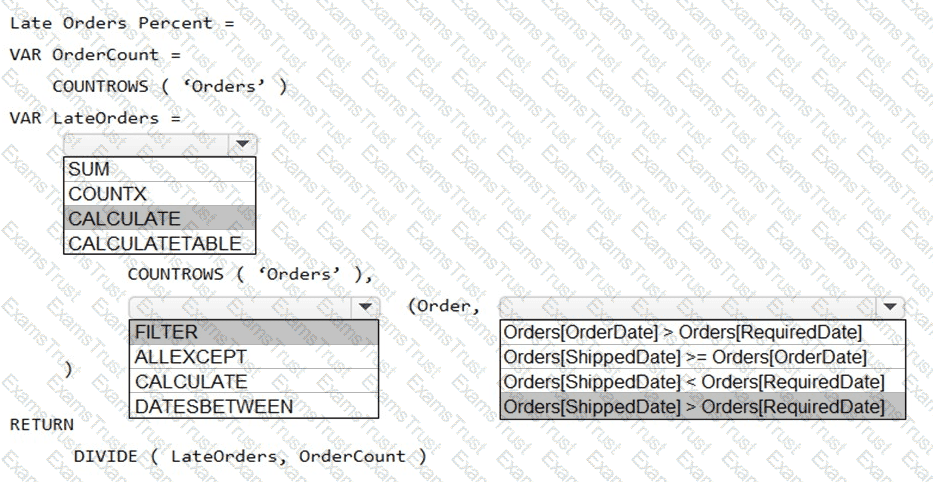
Box 1: CALCULATE
CALCULATE evaluates an expression in a modified filter context.
Syntax: CALCULATE(
Expression - The expression to be evaluated.
filter1, filter2,… (Optional) Boolean expressions or table expressions that defines filters, or filter modifier functions.
Box 2: FILTER
FILTER returns a table that represents a subset of another table or expression.
Syntax: FILTER(