You have a Power Bl report hosted on the Power Bl service. The report displays expenses by department for department managers and contains a line chart that shows expenses by month. You need to ensure that users can choose between viewing the report as a line chart or a column chart. The solution must minimize development and maintenance effort. What should you do?
You are using Azure Synapse Studio to explore a dataset that contains data about taxi trips.
You need to create a chart that will show the total trip distance according to the number of passengers as shown in the following exhibit.
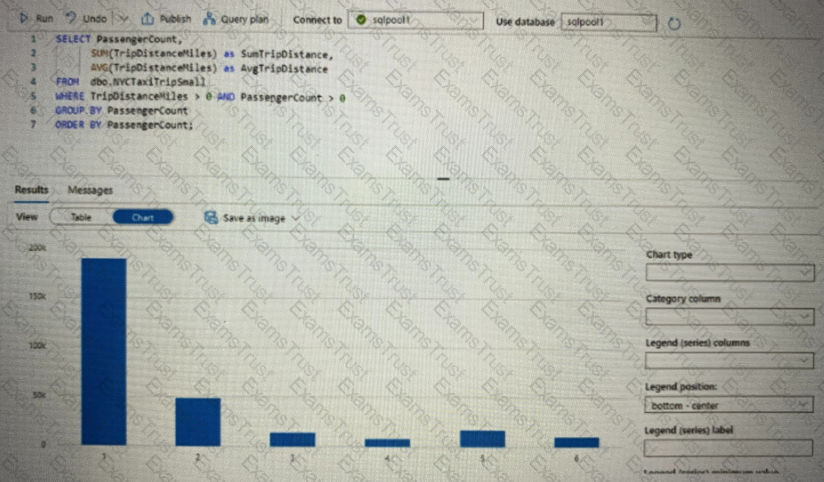
How should you configure the chart? To answer, select the appropriate options in the answer area. NOTE: Each correct selection is worth one point.

Note: This question is part of a series of questions that present the same scenario. Each question in the series contains a unique solution that might meet the stated goals. Some question sets might have more than one correct solution, while others might not have a correct solution.
After you answer a question in this section, you will NOT be able to return to it. As a result, these questions will not appear in the review screen.
You have a Power Bl dataset named Dataset1.
In Dataset1, you currently have 50 measures that use the same time intelligence logic.
You need to reduce the number of measures, while maintaining the current functionality.
Solution: From Tabular Editor, you create a calculation group.
Does this meet the goal?
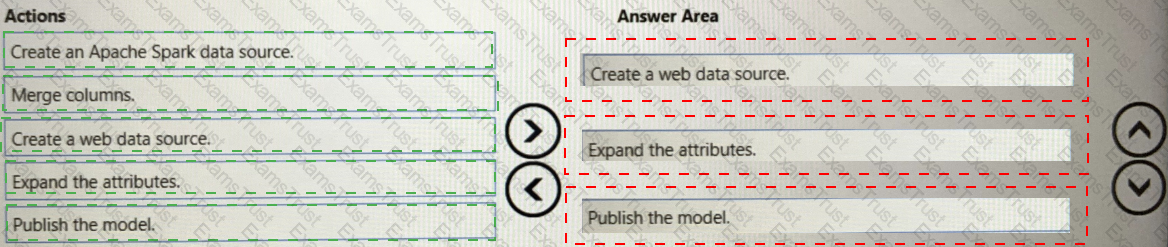
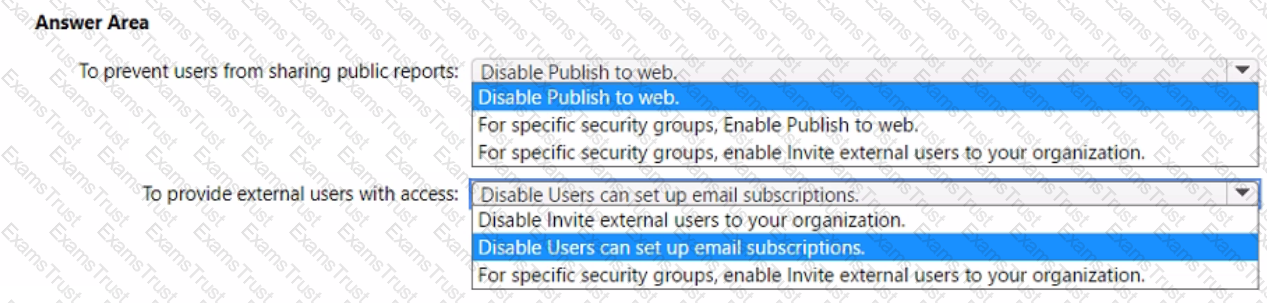
You need to provide users with a reproducible method to connect to a data source and transform the data by using an Al function. The solution must meet the following requirement
• Minimize development effort.
• Avoid including data in the file.
Which type of file should you create?
You have an Azure Synapse Analytics workspace that is connected to an Azure Data Lake Storage Gen2 account.
From Synapse Studio, you run the following query.

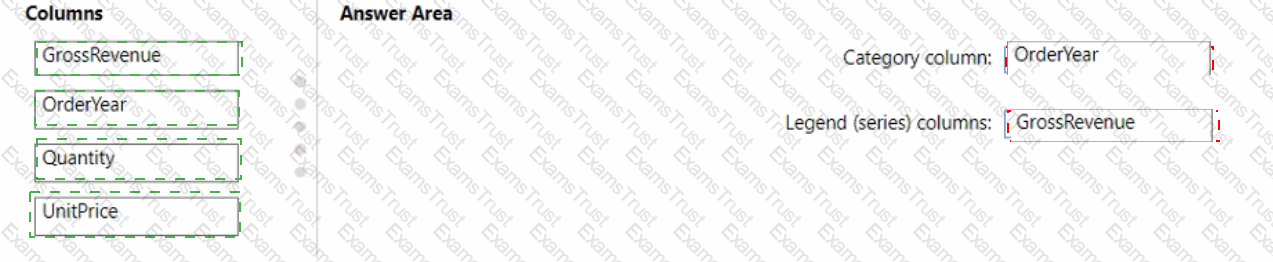
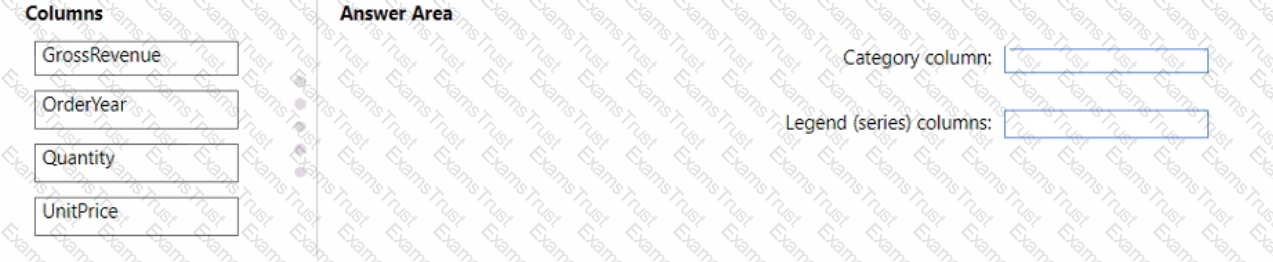
You need to create a column chart to visualize the changes in gross revenue over time.
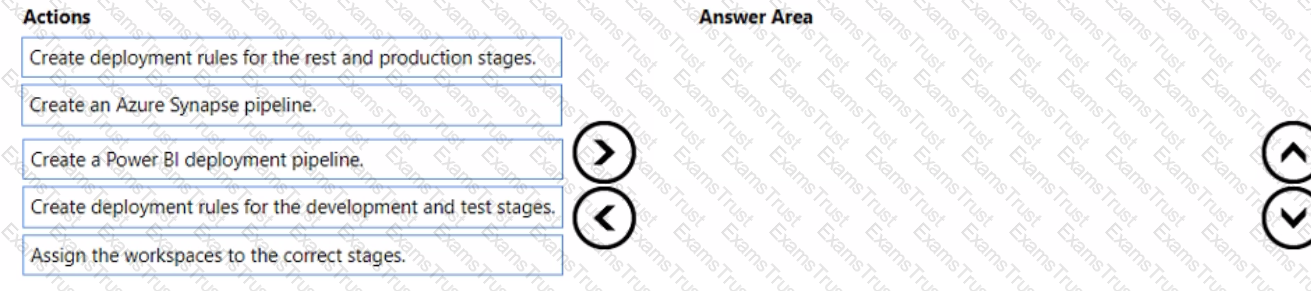
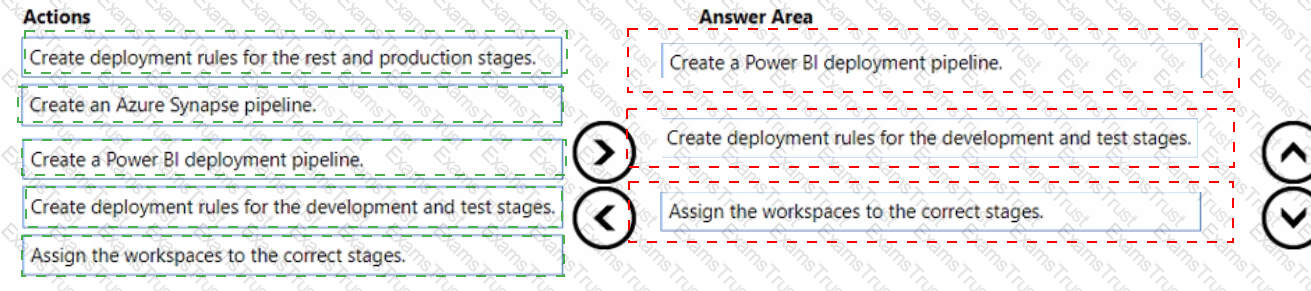
How should you populate the chart? To answer, drag the appropriate columns to the correct settings. Each column may be used once, more than once, or not at all. You may need to drag the split bar between panes or scroll to view content.
NOTE: Each correct selection is worth one point.
You are using GitHub as a source control solution for an Azure Synapse Studio workspace. You need to modify the source control solution to use an Azure DevOps Git repository. What should you do first?
You have a group of data scientists who must create machine learning models and run periodic experiments on a large dataset.
You need to recommend an Azure Synapse Analytics pool for the data scientists. The solution must minimize costs.
Which type of pool should you recommend?
You open a Power Bl Desktop report that contains an imported data model and a single report page.
You open Performance analyzer, start recording, and refresh the visuals on the page. The recording produces the results shown in the following exhibit
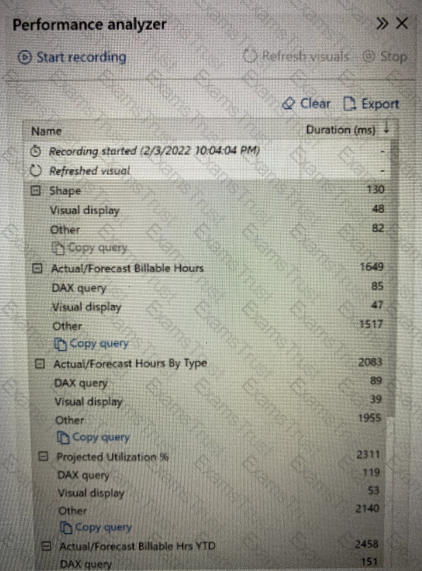
What can you identify from the results?
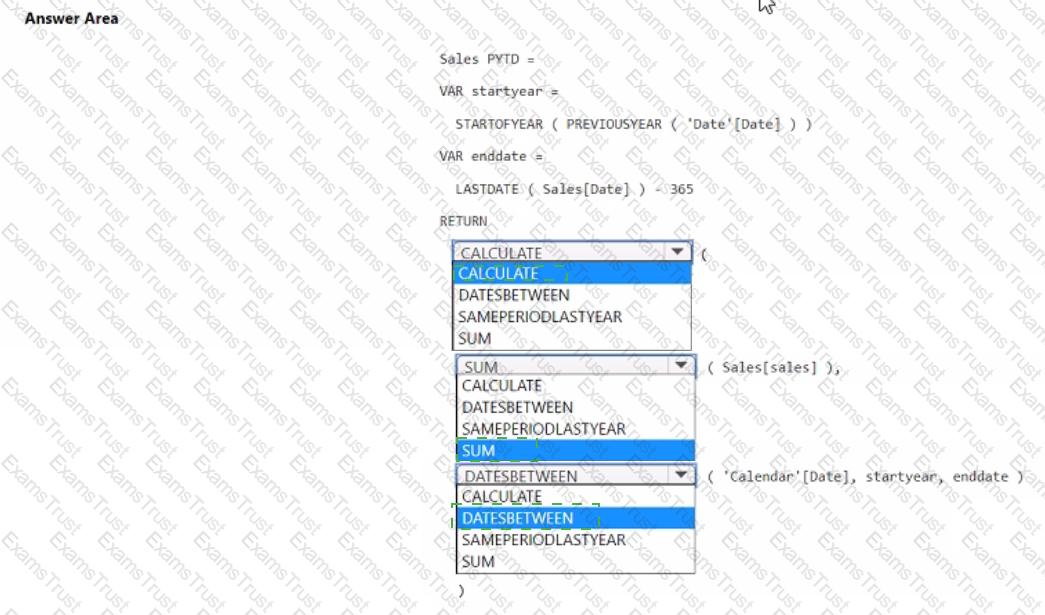
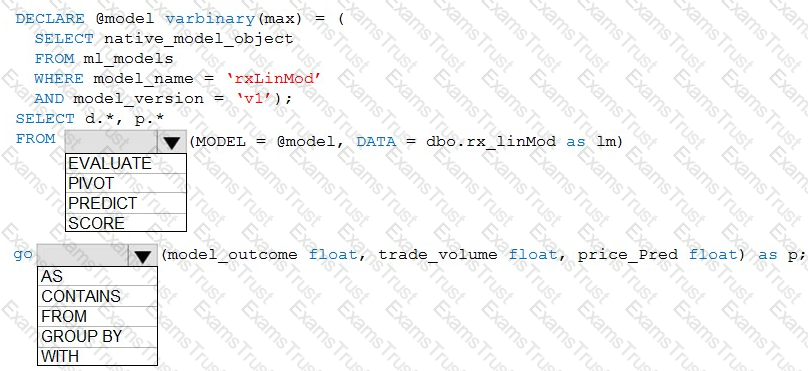
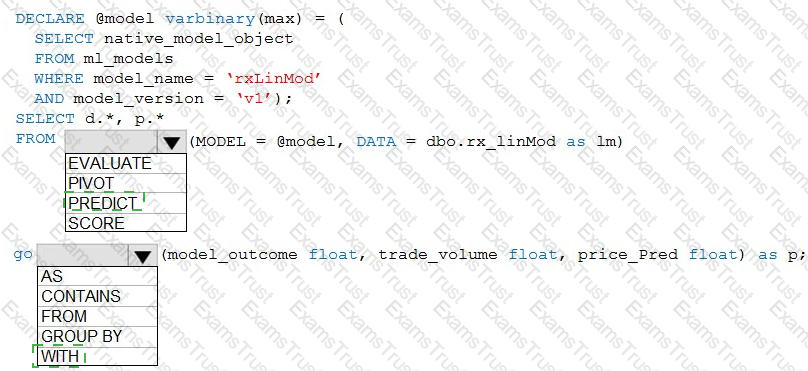
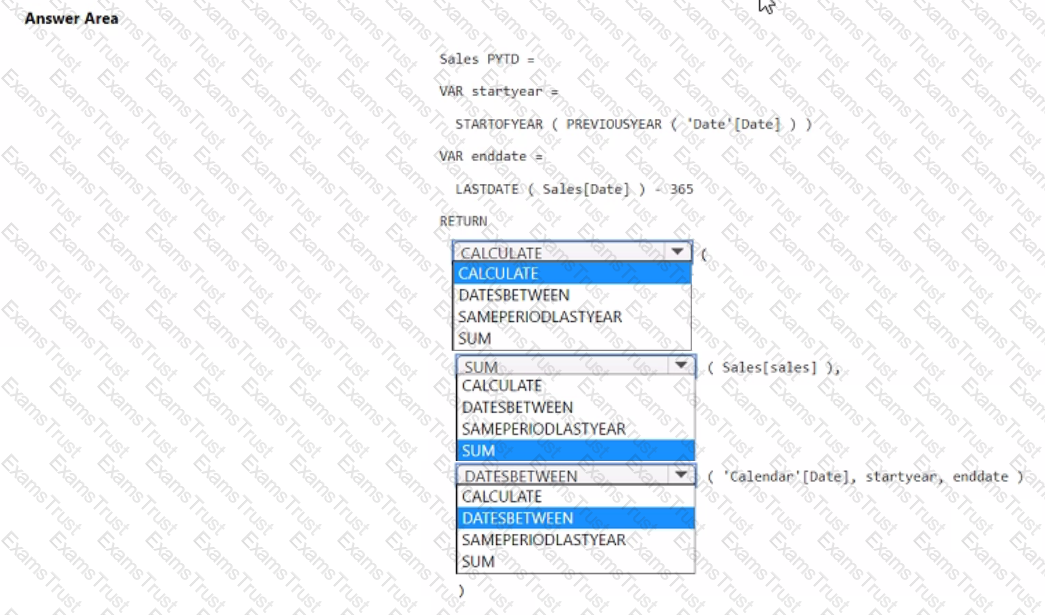
You are enhancing a Power Bl model that has DAX calculations.
You need to create a DAX measure that returns the year-to-date total sales from the same date from the previous calendar year.
How should you complete the measure? To answer, select the appropriate options in the answer area.
NOTE: Each correct selection is worth one point.
After you answer a question in this section, you will NOT be able to return to it. As a result, these questions will not appear in the review screen.
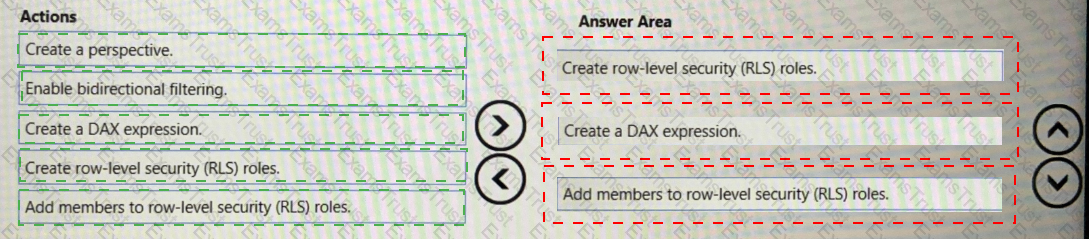
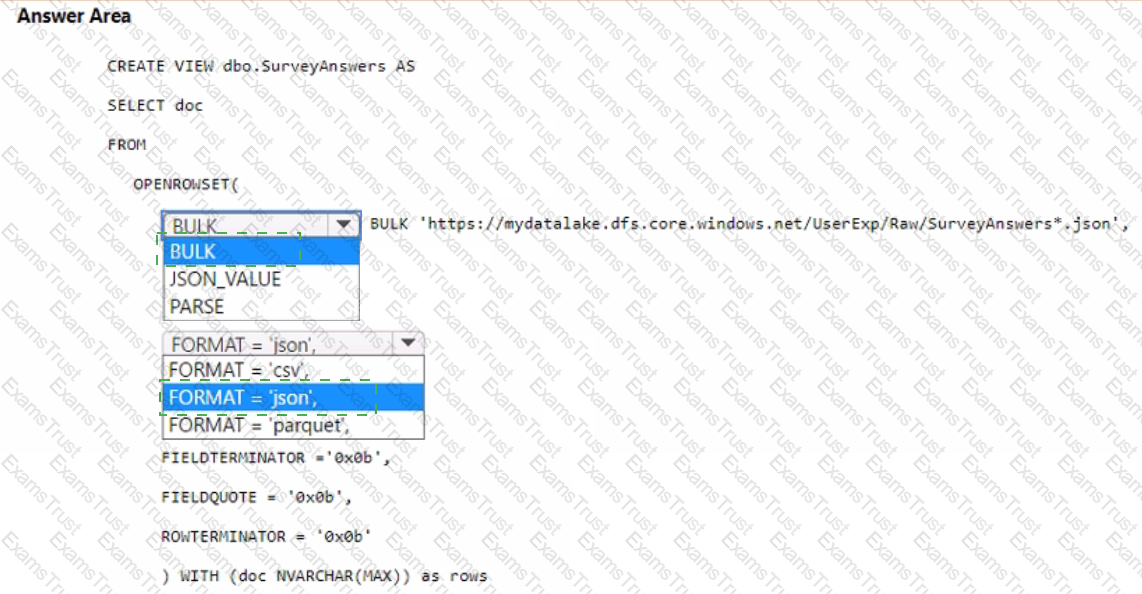
You are using an Azure Synapse Analytics serverless SQL pool to query a collection of Apache Parquet files by using automatic schema inference. The files contain more than 40 million rows of UTF-8-encoded business names, survey names, and participant counts. The database is configured to use the default collation.
The queries use open row set and infer the schema shown in the following table.
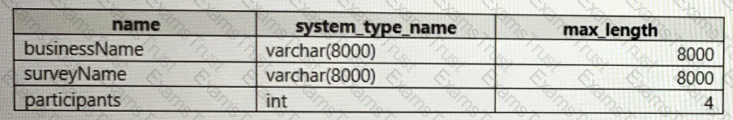
You need to recommend changes to the queries to reduce I/O reads and tempdb usage.
Solution: You recommend using openrowset with to explicitly define the collation for businessName and surveyName as Latim_Generai_100_BiN2_UTF8.
Does this meet the goal?
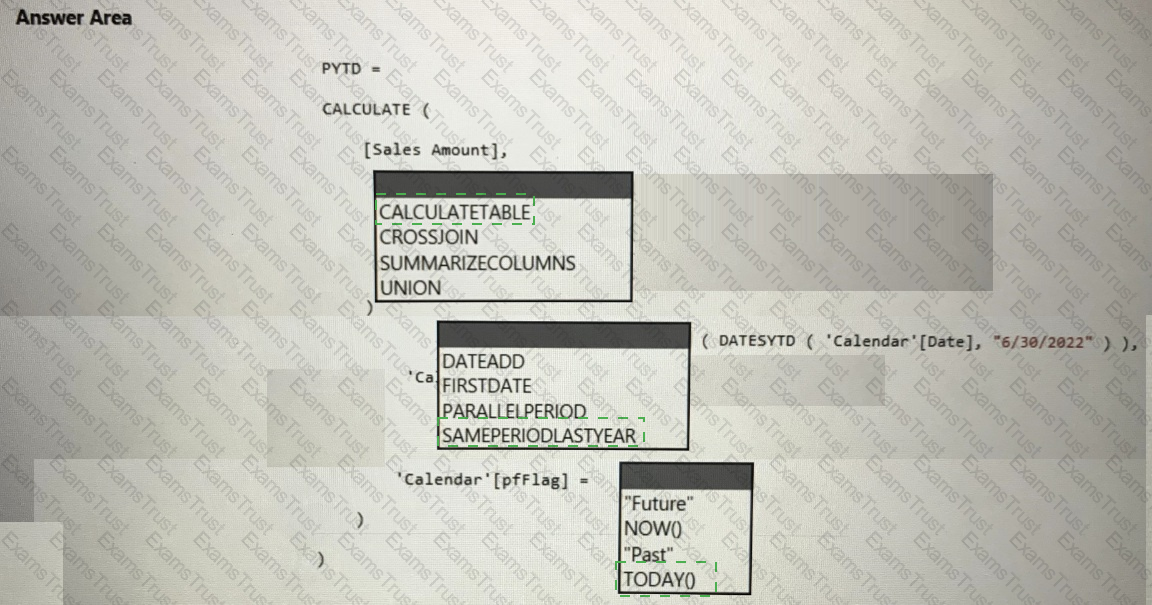
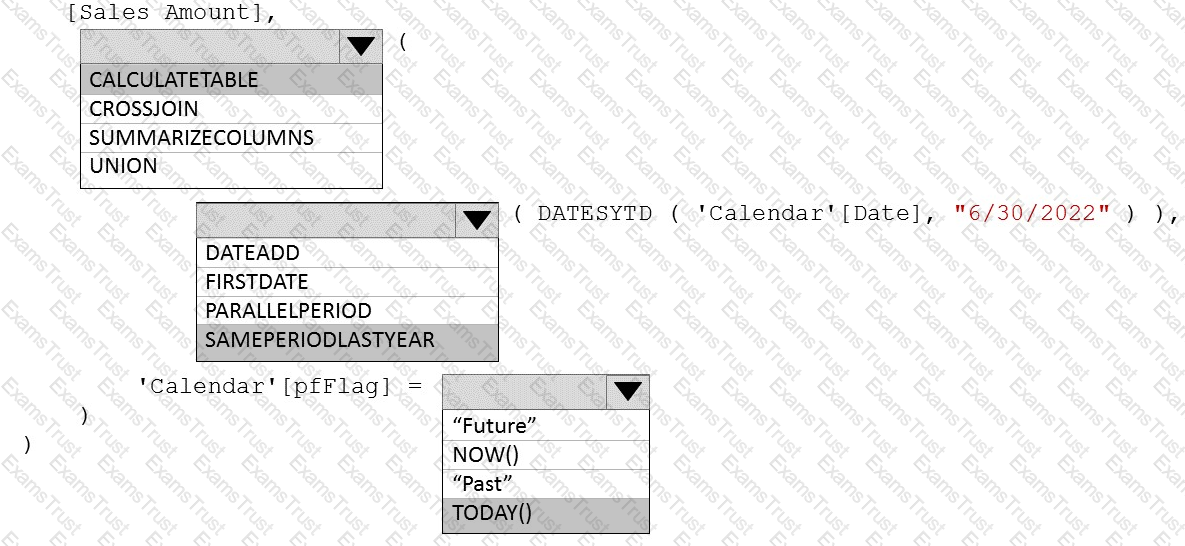
You are building a Power Bl dataset that contains a table named Calendar. Calendar contains the following calculated column.
pfflag = IF('Calendar'[Date] < TOOAYQ, "Past", "Future")
You need to create a measure that will perform a fiscal prior year-to-date calculation that meets the following requirements:
• Returns the fiscal prior year-to-date value for [sales Amount]
• Uses a fiscal year end of June 30
• Produces no result for dates in the future
How should you complete the DAX expression? To answer, select the appropriate options in the answer area.
NOTE: Each correct selection is worth one point.