Weekend Sale Special Limited Time 65% Discount Offer - Ends in 0d 00h 00m 00s - Coupon code: suredis

IFoA IFoA_CAA_M0 Module 0 - Entry Exam Exam Practice Test

Page: 1 / 6
Total 64 questions

Module 0 - Entry Exam Questions and Answers

Testing Engine

  • Product Type: Testing Engine
$42  $119.99

PDF Study Guide

  • Product Type: PDF Study Guide
$36.75  $104.99
Question 1

The table below shows the distribution of the number of people in each household in a village.


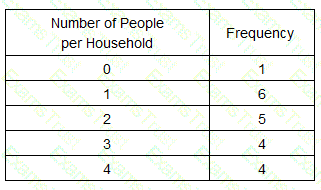
Determine which of the following inequalities is true for the number of people living in a house.

Options:

A.

Mode < Median < Mean

B.

Mode < Mean < Median

C.

Median < Mean < Mode

D.

Median < Mode < Mean

Question 2

Calculate the total area enclosed by the x-axis and the function below, between x = 1.5 and x = 2.

f(x) = 2x3

Options:

A.

2.734

B.

5.469

C.

8.000

D.

10.938

Question 3

The graph shows the frequency distribution of the age of people with a certain kind of insurance contract.


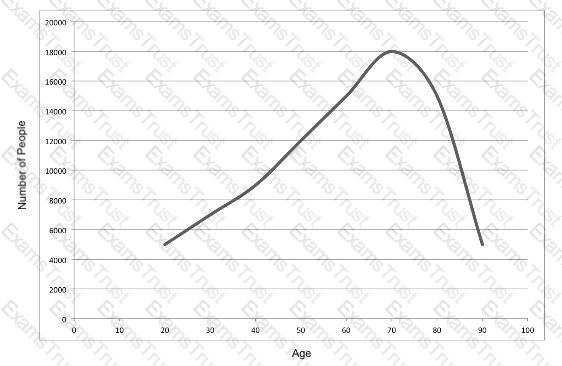
Describe the shape of the underlying data.

Options:

A.

Negatively skewed

B.

Positively skewed

C.

Symmetric

D.

Symmetric about the mean

Question 4

1/5 of actuarial students like skiing.

2/5of actuarial students like snowboarding.

1/3  of actuarial students like skiing and snowboarding.


Calculate the proportion of actuarial students that like skiing or snowboarding.

A)

B)

C)

D)

Options:

A.

Option A

B.

Option B

C.

Option C

D.

Option D

Question 5

Identify the meaning of: | x | > 5

Options:

A.

x is greater than 5.

B.

x is greater than or equal to 5.

C.

x is greater than 5 or x is less than -5.

D.

x is greater than or equal to 5, or x is less than or equal to -5.

Question 6

Define the standard deviation of a finite data set.

Options:

A.

The standard deviation is the sum of the difference between each data point and its expected value.

B.

The standard deviation is the product of the difference between each data point and its expected value.

C.

The standard deviation is the square root of the product of the squared difference between each data point and its expected value.

D.

The standard deviation is the square root of the average of the squared difference between each data point and its expected value.

Question 7

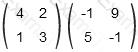
Calculate the determinant of the product of the matrices given below:


Options:

A.

-0.00227

B.

-60

C.

-78

D.

-440

Question 8

For random variable X, use the following statistics to calculate its coefficient of skewness based on central moments.

E(X) = 3.940

E(X2) = 21.466

skew(X) = E[(X - μ)3] = 6.008

Options:

A.

-0.415

B.

0.060

C.

0.415

D.

0.768

Question 9

State what the limit of a function with input variable x represents.

Options:

A.

The limit represents the smallest value that the function can take over its considered range.

B.

The limit represents the behaviour of a function as x approaches a certain value.

C.

The limit represents the value of x for which the function is incalculable.

D.

The limit represents the value of the function when x=0.

Page: 1 / 6
Total 64 questions