When we compare short-term and long-term Capability which of these is true?
Which Element of Waste best describes "the unnecessary movement of materials and goods"?
A Belt working in a supply chain environment has to make a decision to change suppliers of critical raw materials for a new product upgrade. The purchasing manager is depending on the Belt’s effort requiring that the average cost of an internal critical raw material component be less than or equal to $4,200 in order to stay within budget. Using a sample of 35 first article components, a Mean of the new product upgrade price of $4,060, and a Standard Deviation of $98 was estimated. In order to increase the Long Term Z value to 4, what is the maximum long term variation in pricing the Belt can accept for his upgraded critical raw material component?
Sally and Sara sell flower pots at their garage sale. Sally motivates Sara mentioning that they will sell a minimum of 15 pots per day if the outside temperature exceeds 60o F. From a sample, whose population is assumed to follow a Normal Distribution, taken for 30 days at 60 degrees or more an average of 13.6 pots per day were sold with a Standard Deviation of 0.7 pots. For the sales accomplished above, what test would validate if they met their requirements?
In a Fishbone Diagram the 6M’s stand for Methods, Measurements, Machine, Man, Mother Nature and ____________ .
The reported Cpk for a process with an average of 104 units, a spread of 18 units and upper and lower specification limits of 122 and 96 units would be?
When conducting a Hypothesis Test using Continuous Data the proper sample size is influenced only by the extent to which we need to assess a Difference to be detected but not the inherent variation in the process.
When a Belt properly analyzes the results of an experiment he must examine the Residuals in expectation of finding all of the following except _________.
With Measurement System Analysis we are concerned with two issues that impact the potential variability of the data. They are _____________________.
Which of these items are not part of what is necessary for successful Kaizens?
The distance between the Mean of a data set and the Point of Inflection on a Normal curve is called the _______________.
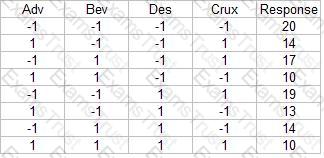
What conclusion is most correct about the Experimental Design shown here with the response in the far right column?
The Mann-Whitney test is a powerful test and is unique to situations from which of the choices listed? (Note: There are 2 correct answers).
Customers make their decisions based on Features, Integrity (of the seller) Delivery and ___________?
During the ______________ phase of 5S is when we might implement a Red Tag program.
Statistical Difference is the magnitude of difference or change required to distinguish between a true difference, brought about by change or improvement, and one that could have occurred by chance.
Sally and Sara sell flower pots at their garage sale. Sally motivates Sara mentioning that they will sell a minimum of 15 pots per day if the outside temperature exceeds 60o F. From a sample, whose population is assumed to follow a Normal Distribution, taken for 30 days at 60 degrees or more an average of 13.6 pots per day were sold with a Standard Deviation of 0.7 pots. The statistical Degrees of Freedom for this example are?
Production Line 1 is able to complete 500 units per shift. Production Line 2 is able to finish 1,500 units per shift. Production Line 2 is 3 times faster than Production Line 1. This analysis is an example of ______________ Scale Data.
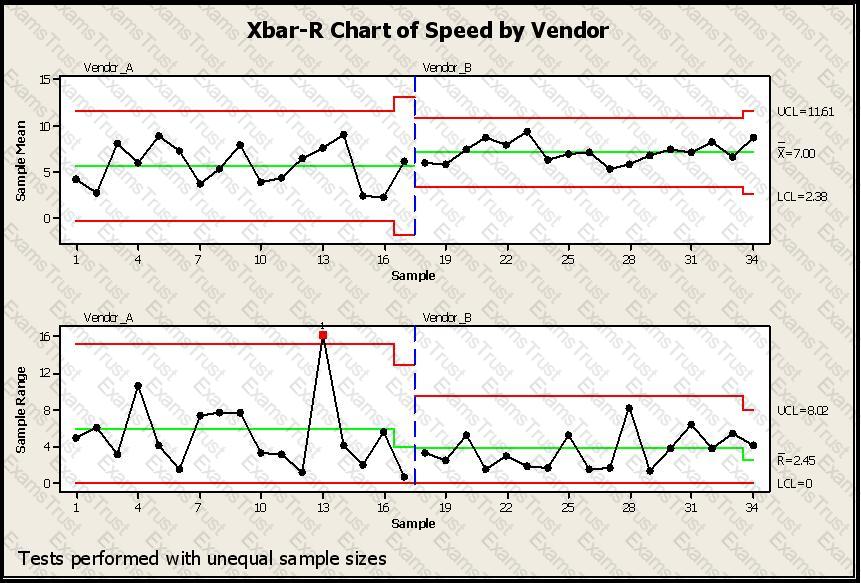
SPC Charts are used extensively in different business and decision-making environments. In this example a vendor is being selected based on speed of delivery. Which of the conclusions would help you pick a vendor for your needs regarding lead-time of delivery from your vendors? (Note: There are 4 correct answers).
The Control Limits width varies if the sample size varies for which type of chart?
Fractional Factorial Designs are used to analyze factors to model the output as a function of inputs if Hypothesis Testing in the Analyze Phase was inadequate to sufficiently narrow the factors that significantly impact the output(s).
The _____________ Distribution would be the most desirable for modeling the number of stitch defects in a portion of fabric.
Two of the key deliverables for the Measure Phase are a robust description of the process and its flow and an assessment of the Management System.
Using this partial Z Table, how many units from a month’s production run are expected to not satisfy customer requirements for the following process?
Upper specification limit: 7.2 Lower specification limit: 4.3 Mean of the process: 5.9 Standard Deviation: 0.65 Monthly production: 450 units
Measurement __________ is defined as the difference between the observed and the expected values for a given set of data.
Statistical Difference is the magnitude of difference or change required to distinguish between a true difference, brought about by change or improvement, and one that could have occurred by chance.
On a _________________ a Belt screens variables, or various inputs, to analyze their relative impact on the output of concern.
A Full Factorial experiment using a 2 level 4 factor approach has been proposed to test the viability of an extrusion machine experiment. How many treatment combinations will this approach involve?
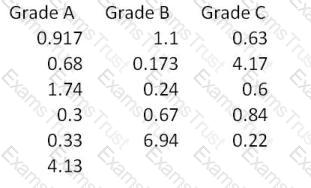
For the data shown here which statement(s) are true? (Note: There are 2 correct answers).
Sally bought a blender from her local appliance store. When she changed blades the blender would not function. For the manufacturer this would be categorized as what type of cost?
If a Belt needed to model the data for the number of weaves in section of carpet fabric she would use the _____________ Distribution approach.
The Central Limit Theorem says that as the sample size becomes large the sample Mean distribution will form a Normal Distribution, ____________________.
Time is always the metric on the horizontal scale of a(n) ___________ Chart.
It would be more likely than not for a Belt conducting a Regression Analysis to find that the _______________________.
Which of these is not a primary cause for Non-normal Data?
Sally and Sara sell flower pots at their garage sale. Martha motivates Rose mentioning that they will sell a minimum of 16 pots per day if the outside temperature exceeds 60o F. From a sample, whose population is assumed to follow a Normal Distribution, taken for 30 days at 60 degrees or more an average of 15.2 pots per day were sold with a Standard Deviation of 0.6 pots. What is the Z value for this sales process?
Relative to a Design of Experiments the term ________________ refers to variables being a linear combination of each other.
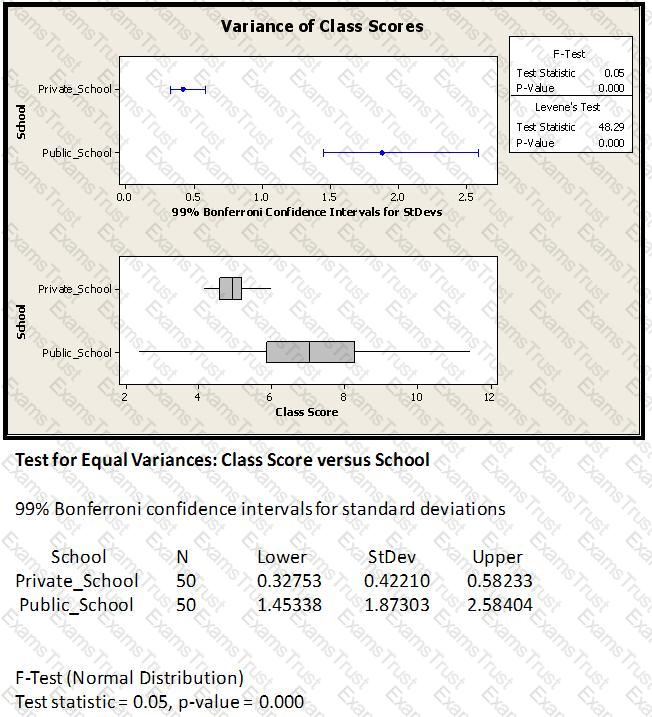
From the variance F-test shown above, which of these conclusions is/are valid?
If a process has subgroups for Variable data and the process runs for a long period of time, then the best pair of SPC Charts to use would be an Xbar and _________.
For her injection molding project a Belt needed to track the percentage of defectives of a particular sample set so she used a ___________ to display the data?
If in an experiment all possible variable pairs sum to zero the design is Orthogonal.
An operator is measuring the distance between two points. Which is most likely to be influenced by the operator?
Fractional Factorial, ____________and Response Surface Method are types of planned experiments.
Which of these graphs demonstrates conditions which would be sufficient to enable OCAP for the process?
Cost of Poor Quality (COPQ) can be classified as Visible Costs and Hidden Costs. Which of these items is a Visible Cost?