Labour Day Special Limited Time 65% Discount Offer - Ends in 0d 00h 00m 00s - Coupon code: suredis

Google Looker-Business-Analyst Looker Business Analyst Exam Exam Practice Test

Looker Business Analyst Exam Questions and Answers

Testing Engine

  • Product Type: Testing Engine
$42  $119.99

PDF Study Guide

  • Product Type: PDF Study Guide
$36.75  $104.99
Question 1

An analyst works on the data team at an organization that maintains multiple similar Explores. The analyst has access to see every Explore, but knows that employees in the finance department only have access to explores tagged Finance.

There is an Employee Compensation Data Finance Explore that the finance department has access to. The analyst usually uses an All Employee Data Explore that also includes personally identifiable information.

What should the analyst do to ensure proper access if the analyst wants to send an example visualization to the finance team?

Options:

A.

Create Merged Results with the Employee Compensation Data Finance Explore and the All Employee Data Explore, and send the URL of the Merged Results.

B.

Use the Employee Compensation Data Finance Explore and send the URL of the Explore to the finance team.

C.

Use the All Employee Data Explore, but use Looker’s built-in Send functionality to email the visualization.

D.

Use the All Employee Data Explore, add a filter to exclude personally identifiable information, and send the URL of the Explore to the finance team.

Question 2

An analyst is trying to create a pie chart showing the breakdown of the top sales by brand in an Explore. The analyst selects the Brand Name dimension and a measure for the Count of Items Sold. The analyst then selects the pie chart visualization, but sees the error “Too Many Rows: Pie charts can display a maximum of 50 rows of data.”

How can the analyst resolve this error and create a pie chart that will always show the top brands by items sold?

Options:

A.

Sort the data by Count of Items Sold descending and apply a row limit of 50.

B.

Sort the data by Brand Name alphabetically and apply a row limit of 50.

C.

Apply a filter on the Count of Items Sold measure that requires the count to be greater than zero.

D.

Apply a filter on the Count of Items Sold measure that requires the count to be not NULL, sort the data by Count of Items Sold ascending, and apply a row limit of 50.

Question 3

The analyst is exploring weekly sales revenue in the last 3 months using a line chart. One requirement is to show the sales target $30,000 in the chart.

Which solution can help the analyst display the sales target?

Options:

A.

Add a trend line for 30000.

B.

Add a Tick Density of 30000.

C.

Add a reference line for 30000.

D.

Add a table calculation to hide values less than 30000.

Question 4

A company has an operational dashboard that needs to display the latest data every 5 minutes on a monitor.

How should the analyst configure the dashboard?

Options:

A.

Set the dashboard schedule to run every 5 minutes.

B.

Set the dashboard auto refresh to 5 minutes.

C.

Set the dashboard to run on load every 5 minutes.

D.

Set the dashboard schedule to 5 minutes and “send if the results have changed”.

Question 5

An analyst needs to send a Look to an external client in CSV format. When the data is being downloaded, the Limit section has the option to select All Results grayed out, with text reading “All Results Unavailable.”

What are three causes of this message? (Choose three.)

Options:

A.

The Row Limit chosen in the Look is too high.

B.

There is a table calculation in the Look.

C.

Unlimited results are unsupported by CSV format.

D.

The Row Totals option is turned on in the Look.

E.

There is a Running Total measure in the Look.

F.

The Totals option is turned on in the Look.

Question 6

An analyst needs to compare monthly sales, year over year, based on when an order was created, as shown in the exhibit.

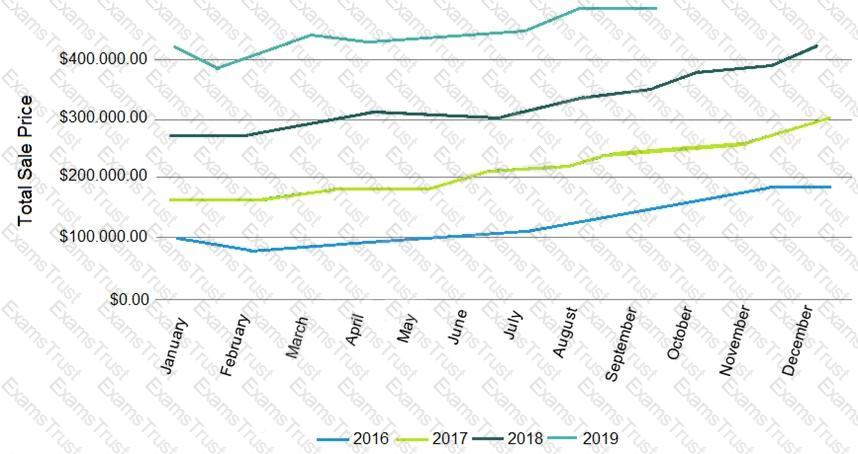
How should the analyst, in addition to selecting the measure Total Sales build the report?

Options:

A.

Select the dimension Created Month, and pivot on the dimension Created Year.

B.

Select the dimension Created Year, and pivot on the dimension Created Month.

C.

Select the dimension Created Month Name, and pivot on the dimension Created Year.

D.

Select the dimension Created Year, and pivot on the dimension Created Month Name.