A team’s goal is to improve information flow in a payroll function. They make thirty-three Post-It® notes, each listing an issue for further investigation. After some discussion, they group them into four categories: mandated record keeping, privacy concerns, insurance concerns and transfer concerns.
This grouping process is best described by which approach to problem solving?
A population is bimodal with a variance of 5.77. One hundred samples of size 30 are randomly collected and the 100 sample means are calculated. The standard deviation of these sample means is approximately:
P(A) = .42, P(B) = .58, P(A&B) = .10. Find P(A or B).
(Refer to the previous problem) To estimate the within treatment variance the experimenters would calculate the variances of:
The following data were collected on the diameters of turned shafts: 2.506 2.508 2.505 2.505. These values are:
I. Attribute data
II. Discrete data
III. Variables data
IV. Continuous data
This table displays the inventory of fasteners in a storage cabinet. An item is selected at random from the fastener cabinet.
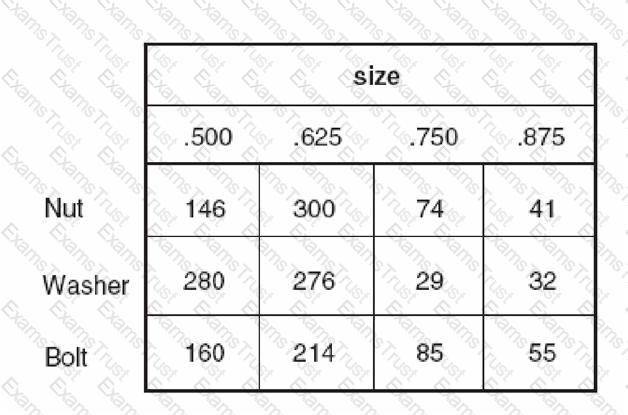
Find the approximate probability it is larger than 1/2.
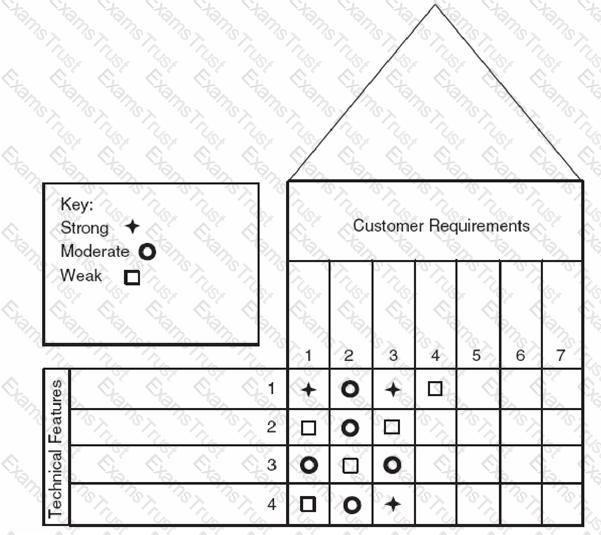
Customer requirement #3 has a ______________ relationship with technical feature #3.

Is it safe to assume that the interaction effects are negligible?

A team wants a technique for displaying the connection between various customer needs and various features on a product. They should use:
The Central Limit Theorem states that the distribution of sample means approximates a normal distribution if:
This is an example of part of a:
A quality engineer employed by a hospital is asked to improve the process of medication storage in locked cabinets near patient doors. One defect that occurs rarely is that the medication caddy is left out when the cabinet is relocked. The engineer installs a gravity activated arm that will not permit the door to close when the caddy isn’t inside.
This improvement is best described by which approach to problem solving?
An automatic gaging system is to be installed in a process. The gage will insert data values into a data base from which machine adjustments will be made automatically. A critical factor in specifying the equipment is:
A team has been asked to reduce the cycle time for a process. The team decides to collect baseline data. It will do this by:
There are 14 different defects that can occur on a completed time card. The payroll department collects 328 cards and finds a total of 87 defects. DPMO =:
A quality leader who did extensive work with Japanese industry is:
Customer segmentation refers to:
The leader in the quality movement who recommended that organizations “eliminate numerical quotas for the work force and numerical goals for management”:
A population of size 1,000,000 has mean 42 and standard deviation 6. Sixty random samples, each of size 15 are selected. According to the Central Limit Theorem the distribution of the sixty sample means has a standard deviation of approximately:

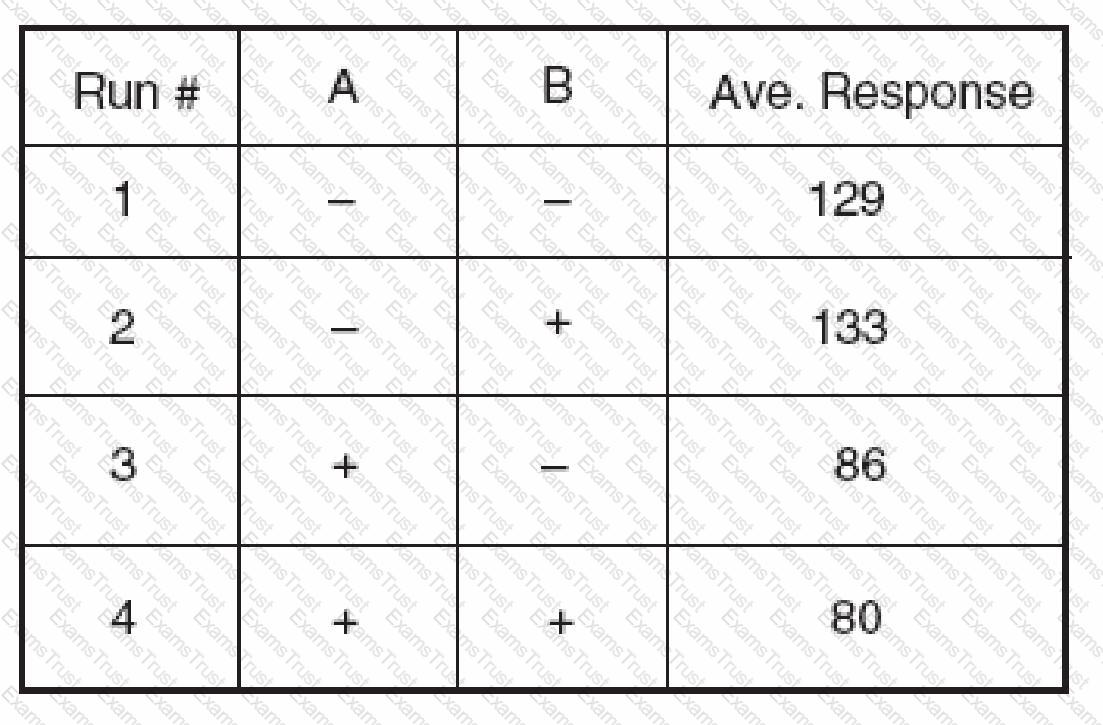
This experimental design is an example of:
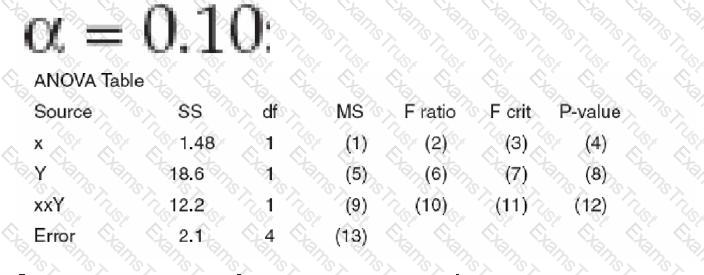
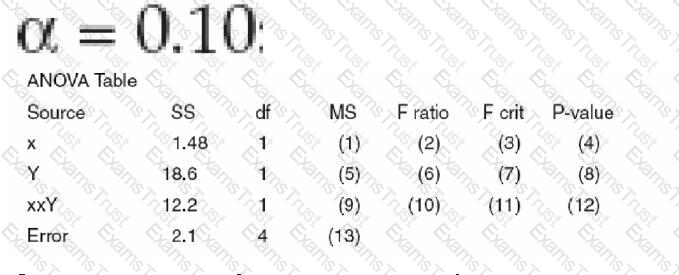
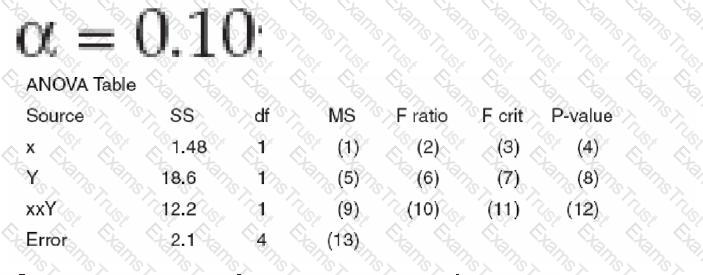
Find the value of (9) in the ANOVA table. Assume:
A machine tool vender wants to sell an injection molding machine. The current machine produces 3.2% defectives. A sample of 1100 from the vender’s machine has 2.9% defective. Do these numbers indicate that the proposed machine has a lower rate of defectives?
Find the value of (1) in the ANOVA table. Assume:
The preferred method for determining statistically whether factor A or B is significant requires what additional information?
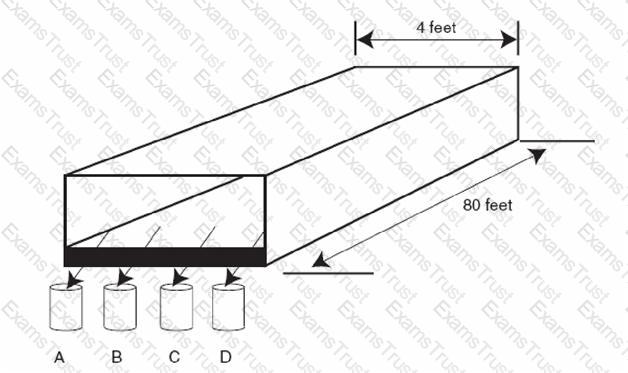
SCENARIO A Six Sigma team is measuring the moisture content of corn starch as it leaves the conveyer belt of a dryer. They collect one sample four cups of starch at times indicated in the chart at fixed locations labeled A, B, C, and D across the end of the belt. See the diagram below.
Find the sample linear correlation coefficient and the sample coefficient of determination for the data in problem VI.11.
SCENARIO
A Six Sigma team is measuring the moisture content of corn starch as it leaves the conveyer belt of a dryer. They collect one sample four cups of starch at times indicated in the chart at fixed locations labeled A, B, C, and D across the end of the belt. See the diagram below.
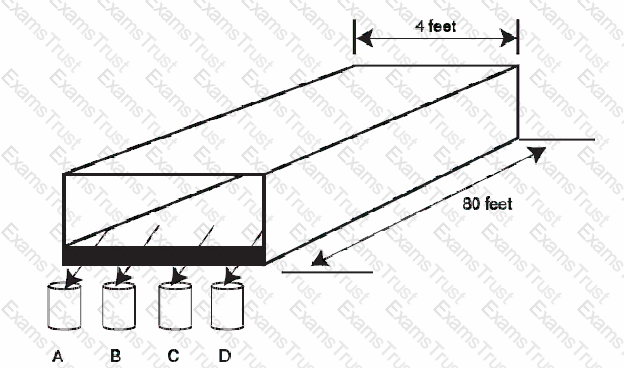
After some more work on the dryer, additional data are collected which when plotted looks like this:
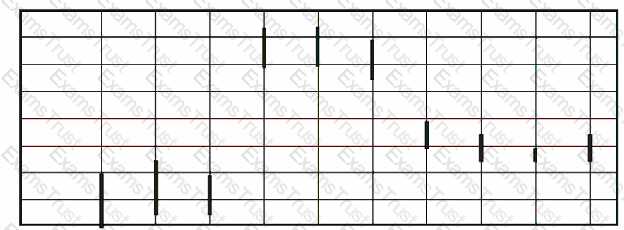
Which type of variation dominates?
Find the value of (2) in the ANOVA table. Assume:
Mathematically, the LEAST informative of the four measurement scales is
This experimental design is:
You are a Project Manager wanting to compare on time delivery (%) of Team Leads across 4 teams, your choice of technique would be?
An x-bar and R chart is used to monitor a process. One week ago a new type of raw material was introduced and since that time 60 points have been plotted on the xbar chart and all are in the middle third of the chart. The corresponding 60 points on the R chart are all below the average range. This indicates that:
Lean Enterprise is based on the premise that anywhere work is being done which of these is also occurring?
The Graph which helps to identify and prioritize problems to be solved?
In the theory of constraints the “subordinate” step refers to:
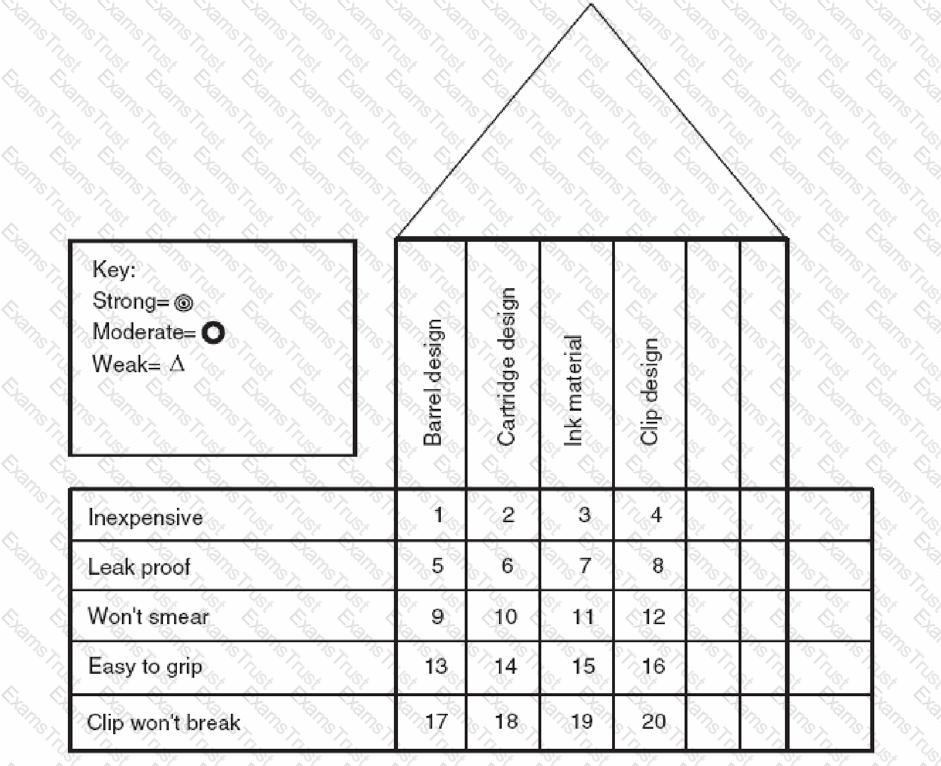
This QFD matrix was used in the design process for a ball point pen. What symbol is appropriate for the square labeled 3?

An assembly line has 3? × 3? squares painted behind each person. Signs indicate the parts and quantities that should be placed there. This is an example of:
A complex system has many causes and effects. These may be illustrated on which of the following:
The term used to describe the risk of a Type I error in a test of hypotheses is?
A principle disadvantage of fractional factorial experimental designs is:
This QFD matrix was used in the design process for a ball point pen. What symbol is appropriate for the square labeled 1?
An x-bar control chart has been established with control limits of 3.245 and 3.257, n = 5. An engineer collects the following sample and plots the average on the control chart: 3.257, 3,256, 3. 258, 3.259.
This QFD matrix was used in the design process for a ball point pen. What symbol is appropriate for the square labeled 12?

The critical path for a project is best described as the
What is the value of the test statistic?
Process data being used in the initial setup of a process are assumed to have a normal distribution. If the nominal (target) is set at the center of the distribution, and the specification limits are set at ± 3σ from the center, the Cpkis equal to
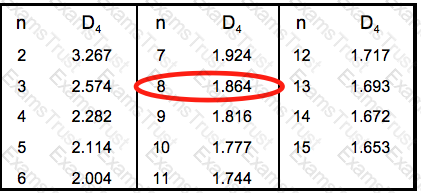
A set of data from a process has 8 readings per sample and 50 samples. The mean of the 50 sample means is 12.62. The mean of the 50 ranges is 0.18.Find control limits for the R chart.
Which of the following tools can be used to identify and quantify the source of a problem?
A tree diagram can be used to do which of the following?
If special causes are assigned in the process variations, then the UCL and LCL would be recomputed without removing those outliers. (True/False)
A set of data from a process has 8 readings per sample and 50 samples. The mean of the 50 sample means is 12.62. The mean of the 50 ranges is 0.18.A customer requires that SPC charts be done on their forms which have spaces for only 5 readings per sample. What should be the UCL and LCL for the new averages chart?
The null hypothesis should be:
When Tricia empties a box of capacitors she places it at a designated spot on her work table. Sam notices the empty box and brings a full box of capacitors from the stock room. This is an example of:
An experiment is conducted by checking the effect that three different pressures have on the surface appearance of a product. Ten items are produced at each of the three pressures. The number of replications, factors and levels are:
 = 1.864 x 0.18 = 0.33
 = 0.1111 x 0.18 = 0.02