A system board has been replaced on a Dell PowerEdge 16G server. What data can Easy Restore recover?
Service Tag
HBA configuration
PERC configuration
Lifecycle controller log
Understanding Easy Restore Functionality
Server Troubleshooting (32%)
Explain Easy Restore, diagnostic utilities, and hardware diagnostic options
What is Easy Restore?
Easy Restore is a feature in Dell PowerEdge servers that automatically restores system-specific information after a system board replacement.
Purpose: Minimizes downtime and simplifies recovery by retaining critical system identity information.
Data Restored by Easy Restore
Service Tag: The unique identifier (serial number) of the server.
System Configuration Settings: Includes BIOS settings and other non-volatile configurations.
Data NOT Restored by Easy Restore
Option B: HBA Configuration
Host Bus Adapter settings are not restored automatically.
Option C: PERC Configuration
RAID configurations need to be backed up and restored separately.
Option D: Lifecycle Controller Log
Logs are stored on the system board and do not transfer after replacement.
Evaluation of Options
Option A: Service Tag
Correct Answer: Easy Restore recovers the Service Tag, preserving the server's identity.
Option B: HBA Configuration
Analysis: Requires manual configuration or restoration from a backup.
Option C: PERC Configuration
Analysis: RAID settings are critical but need separate backup and restoration procedures.
Option D: Lifecycle Controller Log
Analysis: Logs are not preserved after system board replacement.
Dell Operate References
Server Troubleshooting (32%)
Highlights the importance of understanding what Easy Restore can and cannot recover.
Conclusion
After replacing the system board on a Dell PowerEdge 16G server, Easy Restore will recover the Service Tag, ensuring the server maintains its unique identity within the network and management systems.
Which three tools for advanced server management and servicing at-the-box are provided with iDRAC Direct?
(Select 3)
Web Services Management (WSMAN)
Remote Access Controller Admin (RACADM)
Intelligent Platform Management Interface Tool (IPMITool)
iDRAC Web Interface
iDRAC RESTful API
Understanding iDRAC Direct and At-the-Box Management Tools
Server Management and Configuration Tools (14%)
Define the function of the iDRAC, login procedures, licensing, and connection methods
Explain the management interface options - LCC, racadm, OMSA, iSM, OME
What is iDRAC Direct?
iDRAC Direct is a feature that allows administrators to connect directly to the iDRAC interface using a USB connection.
Purpose: Provides at-the-box management capabilities without the need for network access.
Connection: Utilizes a Micro USB port on the server connected to a management station (laptop/PC).
Advanced Server Management Tools Provided with iDRAC Direct
Web Services Management (WSMAN)
Explanation: WSMAN is a standardized protocol that allows for remote management of systems using web services.
Usage with iDRAC Direct: Administrators can execute management tasks via WSMAN over the USB connection provided by iDRAC Direct.
Benefits:
Platform-independent management.
Allows for scripting and automation.
Remote Access Controller Admin (RACADM)
Explanation: RACADM is a command-line utility used to manage the iDRAC and perform various administrative tasks.
Usage with iDRAC Direct: RACADM commands can be executed directly through the USB connection, enabling configuration and monitoring of the server.
Benefits:
Efficient management in environments with limited bandwidth.
Supports scripting for automation.
iDRAC RESTful API
Explanation: The iDRAC RESTful API is a programmatic interface that allows for the management of server hardware using RESTful web services.
Usage with iDRAC Direct: Provides a secure and efficient way to perform management tasks over the USB connection.
Benefits:
Modern API interface compatible with a wide range of programming languages.
Enables integration with automation tools and scripts.
Explanation of Options
Option A: Web Services Management (WSMAN)
Correct Answer: WSMAN is supported over iDRAC Direct for at-the-box management.
Option B: Remote Access Controller Admin (RACADM)
Correct Answer: RACADM commands can be executed via iDRAC Direct.
Option C: Intelligent Platform Management Interface Tool (IPMITool)
Incorrect: While IPMI is a management interface, the IPMITool is not provided specifically with iDRAC Direct for at-the-box management.
Option D: iDRAC Web Interface
Incorrect: The iDRAC Web Interface typically requires network access and is not directly provided over the iDRAC Direct USB connection for at-the-box management.
Option E: iDRAC RESTful API
Correct Answer: The RESTful API is accessible via iDRAC Direct for advanced management.
Dell Operate References
Server Management and Configuration Tools (14%)
Emphasizes understanding various management tools available with iDRAC Direct.
Define the function of the iDRAC, login procedures, licensing, and connection methods
Highlights the use of different interfaces and protocols for server management.
Explain the management interface options - LCC, racadm, OMSA, iSM, OME
Focuses on different tools and their applications in server management.
Conclusion
The three tools provided with iDRAC Direct for advanced server management and at-the-box servicing are:
Web Services Management (WSMAN)
Remote Access Controller Admin (RACADM)
iDRAC RESTful API
These tools enable administrators to perform comprehensive management tasks directly at the server without the need for network connectivity.
A system administrator observes network connectivity issues with their iDRACs.
Which three commands can be used in the Diagnostic Console to troubleshoot this issue?
(Select 3)
show-netstat
ping
ifconfig
ipconfig
arp
Troubleshooting iDRAC Network Connectivity Issues Using Diagnostic Console
Server Troubleshooting (32%)
Explain Easy Restore, diagnostic utilities, and hardware diagnostic options
Analyze the visual indicators on server components - system ID, PSU, and BLINK
Understanding the Diagnostic Console
Diagnostic Console: An interface within iDRAC that provides command-line tools for troubleshooting and diagnosing issues.
Purpose: Allows administrators to execute commands directly on the iDRAC to diagnose network and system problems.
Commands Available for Network Troubleshooting
ping
Usage: Tests connectivity to other network devices by sending ICMP echo requests.
Purpose: Determines if the iDRAC can reach a specified IP address or hostname.
Example: ping 192.168.1.1
ifconfig
Usage: Displays or configures network interface parameters.
Purpose: Checks the status of network interfaces, IP addresses, and subnet masks configured on the iDRAC.
Example: ifconfig eth0
arp
Usage: Displays or modifies the system's ARP table.
Purpose: Helps identify IP to MAC address mappings, useful for diagnosing duplicate IP issues or incorrect network configurations.
Example: arp -a
Explanation of Options
Option A: show-netstat
Explanation: While netstat is a common networking command, show-netstat is not a standard command in the iDRAC Diagnostic Console.
Conclusion: Not a valid command in this context.
Option B: ping
Correct Answer: Used to test network connectivity.
Option C: ifconfig
Correct Answer: Used to display and configure network interface settings.
Option D: ipconfig
Explanation: ipconfig is a Windows command-line utility, not available in the iDRAC (which is Linux-based).
Conclusion: Incorrect.
Option E: arp
Correct Answer: Used to view and manage the ARP cache.
Dell Operate References
Server Troubleshooting (32%)
Emphasizes the use of diagnostic utilities for troubleshooting network issues.
Explain Easy Restore, diagnostic utilities, and hardware diagnostic options
Highlights the importance of understanding and utilizing available tools for diagnostics.
Conclusion
The three commands that can be used in the iDRAC Diagnostic Console to troubleshoot network connectivity issues are:
ping: To test connectivity to other network devices.
ifconfig: To check and configure network interface settings.
arp: To view and manage the Address Resolution Protocol cache.
These commands help identify connectivity problems, misconfigurations, and issues with network interfaces.
What is an advantage of using virtual media from a management station?
ISO can be transferred to the server using a USB flash drive.
No physical presence is required at the data center.
Remote file shares are supported.
Management station can be separated from the server by firewalls or a DMZ.
Advantages of Using Virtual Media from a Management Station
Server Management and Configuration Tools (14%)
Define the function of the iDRAC, login procedures, licensing, and connection methods
Explain the management interface options - LCC, racadm, OMSA, iSM, OME
Understanding Virtual Media
Virtual Media allows administrators to remotely mount media devices (such as CD/DVD drives or ISO images) over the network to a server via the Integrated Dell Remote Access Controller (iDRAC).
Purpose: Enables tasks like installing an operating system, updating firmware, or running diagnostics without needing physical access to the server.
Advantages
Option B: No physical presence is required at the data center
Explanation:
Remote Accessibility: Administrators can perform necessary tasks from any location, eliminating the need to be physically present at the server's location.
Efficiency: Reduces travel time and costs associated with onsite visits.
Business Continuity: Allows for prompt responses to issues, minimizing downtime.
Dell Operate Reference:
Server Management and Configuration Tools (14%): Highlights the importance of remote management capabilities provided by tools like iDRAC and the Virtual Console.
Explanation of Other Options
Option A: ISO can be transferred to the server using a USB flash drive
Analysis: This involves physical transfer and insertion of a USB drive into the server, which contradicts the advantage of using virtual media remotely.
Conclusion: Not an advantage of virtual media from a management station.
Option C: Remote file shares are supported
Analysis: While some virtual media implementations may support remote file shares, the primary advantage is the ability to mount media remotely, not necessarily accessing file shares.
Conclusion: Less accurate than Option B.
Option D: Management station can be separated from the server by firewalls or a DMZ
Analysis: Firewalls and DMZs can actually hinder the use of virtual media due to blocked ports or security restrictions.
Conclusion: Not an advantage and may present challenges.
Conclusion
Using virtual media from a management station provides the significant advantage of allowing administrators to perform tasks without needing to be physically present at the data center. This enhances operational efficiency and responsiveness.
What are two use cases for using a graphic processing unit (GPU)?
(Select 2)
Programmable for a particular application-specific purpose.
Improve performance by accelerating networking hardware.
Model and analyze signal data streams in real time.
Isolate tenants from host management in a cloud landlord-tenant setting.
Accelerate HPC and Al by using financial data for analysis of risk and return.
Understanding GPU Use Cases
Server Components (26%)
Explain how expansion cards are connected and the features of the GPU
Overview of GPUs in Servers
Graphics Processing Units (GPUs) are specialized processors designed to handle complex mathematical computations, particularly those involving parallel processing.
Use Cases:
High-Performance Computing (HPC)
Artificial Intelligence (AI) and Machine Learning
Real-Time Data Processing
Modeling and Simulation
Evaluation of Options
Option A: Programmable for a particular application-specific purpose
Explanation: This describes Field-Programmable Gate Arrays (FPGAs), not GPUs. FPGAs can be programmed for specific tasks at the hardware level.
Conclusion: Not a typical GPU use case.
Option B: Improve performance by accelerating networking hardware
Explanation: Network acceleration is typically achieved using specialized network interface cards (NICs) or SmartNICs, not GPUs.
Conclusion: Not a GPU use case.
Option C: Model and analyze signal data streams in real time
Explanation: GPUs excel at processing large amounts of data in parallel, making them ideal for real-time signal processing and data stream analysis.
Conclusion: Correct Answer
Option D: Isolate tenants from host management in a cloud landlord-tenant setting
Explanation: This pertains to virtualization and security features, such as virtual machines and hypervisors, not specifically GPUs.
Conclusion: Not a GPU use case.
Option E: Accelerate HPC and AI by using financial data for analysis of risk and return
Explanation: GPUs accelerate HPC and AI workloads by handling complex computations efficiently. Analyzing financial data for risk and return is a common AI application that benefits from GPU acceleration.
Conclusion: Correct Answer
Dell Operate References
Server Components (26%)
Explain how expansion cards are connected and the features of the GPU: Understanding the role of GPUs in enhancing server capabilities for specific workloads.
Conclusion
The two correct use cases for GPUs are:
Option C: Modeling and analyzing signal data streams in real time.
Option E: Accelerating HPC and AI tasks, such as analyzing financial data for risk assessment.
These use cases leverage the GPU's ability to process large volumes of data efficiently, improving performance for compute-intensive applications.
An administrator is in a non-secure location with a high latency connection. What option should be used to recover a PowerEdge server using an existing server profile?
iDRAC
Redfish
IPMI
RACADM
Selecting the Appropriate Recovery Tool
Server Management and Configuration Tools (14%)
Explain the management interface options - LCC, racadm, OMSA, iSM, OME
Scenario Analysis
Constraints:
Non-secure location: Security of the connection is a concern.
High latency connection: Requires a tool that operates efficiently over slow networks.
Objective: Recover a PowerEdge server using an existing server profile.
Option Evaluations
Option A: iDRAC
Analysis: While iDRAC provides remote management, accessing it via a web interface may be slow and less secure in high latency and non-secure environments.
Option B: Redfish
Analysis: Redfish uses HTTPS, which is secure but may not perform well over high latency connections and requires more overhead.
Option C: IPMI
Analysis: IPMI lacks robust security features and is not recommended in non-secure locations.
Option D: RACADM
Correct Answer
Advantages:
Secure: Can use SSH for secure command-line access.
Efficient: Command-line interface minimizes bandwidth usage, suitable for high latency.
Powerful: Allows full management of the server, including applying existing server profiles.
Scriptable: Enables automation and faster recovery processes.
Understanding RACADM
RACADM (Remote Access Controller Admin):
A command-line utility for managing Dell servers via iDRAC.
Supports both local and remote management.
Ideal for automated scripts and low-bandwidth situations.
Dell Operate References
Server Management and Configuration Tools (14%)
Emphasizes understanding different management tools and their appropriate use cases.
System Administration (18%)
Covers configuring and managing servers in various environments.
Conclusion
Given the need for a secure and efficient tool in a high latency and non-secure location, RACADM is the optimal choice for recovering the PowerEdge server using an existing server profile.
When does configuration validation run?
Dell diagnostics is run
Entering the BIOS
Loading into Lifecycle Controller
Each time the host powers on
Understanding Configuration Validation in Dell PowerEdge Servers
Server Troubleshooting (32%)
Explain Configuration Validation, crash capture, and minimum to POST
What is Configuration Validation?
Configuration Validation is a diagnostic process performed by Dell PowerEdge servers to ensure that all hardware components and firmware configurations are compatible and functioning correctly. This process checks for any mismatches or errors in the server's hardware configuration that could prevent the system from booting properly.
When Does Configuration Validation Run?
Each Time the Host Powers On:
Explanation:
Configuration Validation runs automatically during the Power-On Self-Test (POST) sequence every time the server is powered on or rebooted.
The server's BIOS performs a series of checks to validate the hardware configuration, ensuring that all components are present, properly connected, and compatible.
If any discrepancies or issues are detected, the server may halt the boot process and display error messages or indicators to alert the administrator.
Importance of Configuration Validation at Power-On:
Hardware Integrity:
Verifies that CPUs, memory modules, storage devices, and other peripherals are correctly installed and operational.
Firmware Compatibility:
Ensures that firmware versions are compatible across components, which is crucial for system stability.
Preventing Boot Failures:
Identifies configuration issues early to prevent system crashes or data loss.
Explanation of Options
Option A: Dell diagnostics is run
Analysis:
Dell Diagnostics is a set of utilities that can be run manually to test hardware components.
It is not automatically executed unless initiated by an administrator.
Conclusion: Incorrect.
Option B: Entering the BIOS
Analysis:
While entering the BIOS allows administrators to view and modify system settings, configuration validation is not specifically triggered by accessing the BIOS.
Conclusion: Incorrect.
Option C: Loading into Lifecycle Controller
Analysis:
The Lifecycle Controller is a management tool for deploying, updating, and configuring servers.
Configuration validation is not exclusively run when accessing the Lifecycle Controller.
Conclusion: Incorrect.
Option D: Each time the host powers on
Analysis:
Configuration validation is inherently part of the POST sequence that runs every time the server powers on.
Conclusion: Correct Answer.
Dell Operate References
Server Troubleshooting (32%)
Explain Configuration Validation, crash capture, and minimum to POST:
Understanding when and how configuration validation occurs is essential for troubleshooting boot-related issues.
Recognizing that this process runs at power-on helps administrators diagnose hardware problems early in the boot sequence.
System Administration (18%)
Verify health status and iDRAC license:
Regular health checks and monitoring complement the automated configuration validation performed during boot.
Conclusion
Configuration Validation runs each time the host powers on as part of the POST process. This ensures that any hardware or configuration issues are detected immediately, allowing administrators to address them promptly and maintain system stability.
Exhibit.
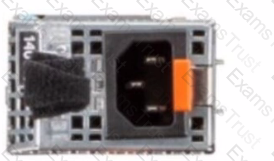
What does the black strap on the power supply handle specify?
PSU
NAF
RAF
Spare PSU
Understanding the Black Strap on the Power Supply Handle
Server Components (26%)
Identify power options and redundancy features, thermal features, and liquid cooling
Explanation of Power Supply Straps
Dell PowerEdge servers often use black straps on power supply units (PSUs) to indicate certain attributes of the PSU. The color of the strap can help identify specific features or categories of the power supply.
What Does "NAF" Mean?
NAF stands for Non-Redundant, Auto Failover.
This indicates that the PSU is part of a non-redundant configuration, but it is capable of automatic failover in the case of power loss.
This is typical in systems with multiple PSUs, where each PSU can take over if the other fails.
Why Not Other Options?
Option A: PSU
The strap does not indicate that the device is just a PSU; rather, it indicates a specific feature of the PSU.
Option C: RAF
RAF stands for Redundant Auto Failover, which is not the correct feature indicated by the black strap.
Option D: Spare PSU
The strap does not indicate that the PSU is a spare unit.
Conclusion
The black strap on the power supply handle indicates that the PSU is NAF (Non-Redundant, Auto Failover). This means it is part of a non-redundant system but capable of automatic failover.
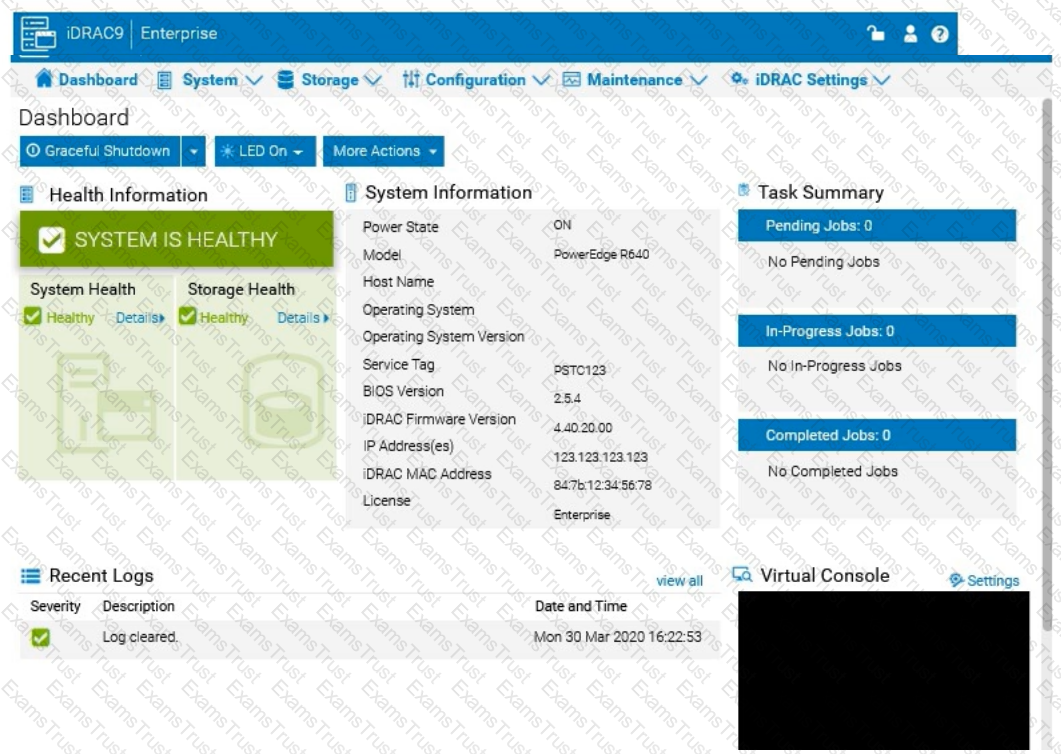
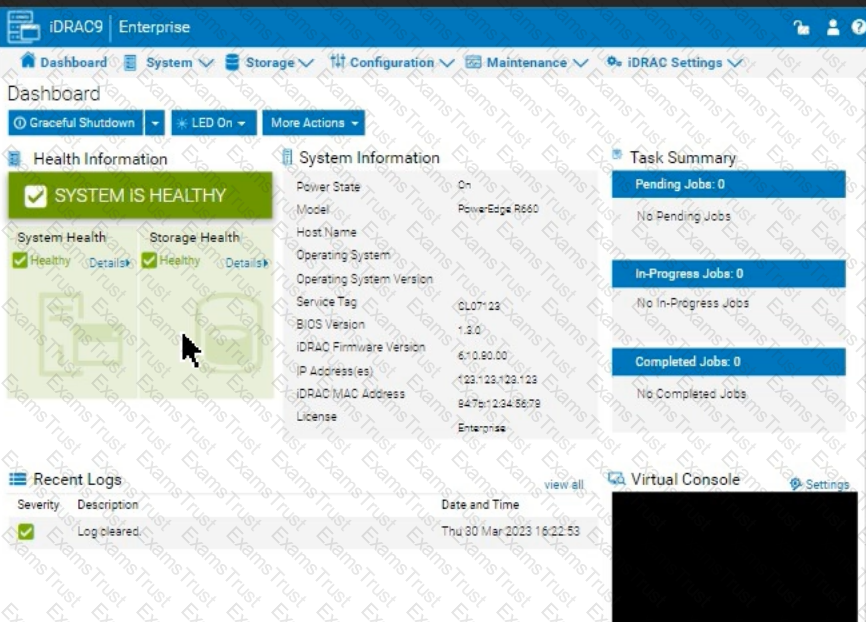
The system administrator receives an email notification on April 30, 2022 that a power issue was reported on the Dell PowerEdge R660. Which log entry helps them investigate this issue for that date?

Under voltage fault detection on power supply 1.
Power supply 2 has failed.
Under voltage fault detected on power supply 2.
Power supply 1 has failed.
To investigate a power issue on a specific date, such as April 30, 2022, the system administrator should examine the iDRAC logs for entries related to power supply faults or failures. Here's how to approach finding the correct answer:
Step-by-Step Approach:
Access the System Logs:
In the iDRAC interface, navigate to the Dashboard tab.
Scroll down to the Recent Logs section or navigate to System Logs under Maintenance or iDRAC Settings (depending on the iDRAC version) to access detailed logs.
Filter Logs by Date:
Use the filter option to specify the date, focusing on entries from April 30, 2022. This will help narrow down relevant events.
Identify Power-Related Entries:
Look for log entries that mention power supply issues or voltage faults around the specified date. In this case, entries related to under-voltage faults or power supply failures will be critical.
Interpret the Log Entries:
Based on typical power fault logs, consider the possible answers:
A. Under voltage fault detection on power supply 1: Indicates a voltage issue was detected on PSU1.
B. Power supply 2 has failed: Indicates PSU2 has completely failed.
C. Under voltage fault detected on power supply 2: Indicates a voltage issue was detected on PSU2.
D. Power supply 1 has failed: Indicates PSU1 has completely failed.
The specific log entry depends on the exact wording in the logs. However, from the options provided, if the administrator received a notification about a power issue, the most likely scenario involves a failure or under-voltage detection.
Using the iDRAC UI, generate and save locally a SupportAssist collection with system
information and debug logs only.
See the Explanation for Step by Step solution.
To generate and save a SupportAssist collection with system information and debug logs only in the iDRAC UI, follow these steps:
Step-by-Step Guide:
Access SupportAssist in iDRAC:
In the iDRAC interface, navigate to the Maintenance tab in the top menu.
From the dropdown, select SupportAssist. This will bring up the SupportAssist options.
Initiate a Collection:
In the SupportAssist section, look for the option to Create a New Collection or Start a Collection.
Choose Collect System Data or Generate a Collection, depending on the version of iDRAC.
Select Collection Components:
When prompted to select components for the collection, check the boxes for System Information and Debug Logs only.
Ensure no other components are selected to limit the collection to just the required data.
Start the Collection:
Confirm your selection, then click Start or Generate. This will initiate the process to gather the specified data from the system.
Save the Collection Locally:
Once the collection is complete, you should see an option to Download or Save the file.
Click the download link and save the collection file locally on your computer.
Verify the Collection File:
Check the downloaded file to ensure it contains only the system information and debug logs. It should be in a format such as ZIP or TAR, depending on the system configuration.
By following these steps, you can successfully generate a SupportAssist collection with just the system information and debug logs and save it to your local system for further review or support purposes.
The system administrator cannot boot their R660 server. To help troubleshooting, use the iDRAC
Ul to enable capturing the full POST sequence for the next time it attempts to boot.
 Answer: See the Explanation for Step by Step solution.
To enable capturing the full POST (Power-On Self-Test) sequence using the iDRAC interface, follow these steps:
Step-by-Step Guide:
Log into the iDRAC Interface:
Access the iDRAC UI using the server’s IP address from a web browser.
Enter your credentials to log in.
Navigate to System BIOS Settings:
Go to the Configuration tab on the top menu.
Select BIOS Settings from the dropdown menu. This will take you to the settings where you can manage BIOS-related configurations.
Enable POST Sequence Logging:
In the BIOS Settings, look for an option related to POST Behavior or Boot Sequence Capture.
Enable Verbose Mode or Capture Full POST Sequence. This setting ensures that the entire POST process is logged in detail during the next boot attempt.
Alternatively, if there is a specific setting for Capture System Boot Logs, enable it to ensure detailed logging during POST.
Apply the Changes:
After enabling the POST capture option, click Apply or Save.
iDRAC may prompt for confirmation or inform you that changes will take effect upon the next reboot. Confirm any prompts as required.
Restart the Server (if necessary):
If the server is currently off, attempt to power it on. If it’s on, you may need to perform a Graceful Shutdown followed by a restart to initiate the POST sequence.
Review POST Logs After Reboot:
Once the server attempts to boot, return to the iDRAC Logs section to review the captured POST logs.
Go to Maintenance > System Event Log or Lifecycle Log to view the detailed logs from the POST sequence. This can help diagnose why the server is failing to boot.
By enabling this setting, you will capture detailed information during the POST process, which can then be reviewed to identify any hardware or configuration issues preventing the server from booting successfully.
A customer wants to change the PSU configuration to a 2+0 with PSU2 as the primary. Use the simulator to complete this task in the iDRAC UI.

See the Explanation for Step by Step solution.
To change the Power Supply Unit (PSU) configuration to a 2+0 setup with PSU2 as the primary in the iDRAC interface, follow these steps:
Step-by-Step Guide:
Navigate to Power Management Settings:
In the iDRAC interface, go to the Configuration tab at the top.
Select Power Management from the dropdown options.
Locate the Power Configuration Section:
Within the Power Management settings, look for a section labeled Power Configuration or Power Supply Configuration.
Select the Redundancy Policy:
Change the Redundancy Policy to 2+0. In this configuration, there will be no redundancy, and both power supplies will be active but configured as independent power sources without failover.
Set PSU2 as the Primary PSU:
Locate the option to designate the Primary PSU. Select PSU2 as the primary power source.
This setting ensures that PSU2 will handle the primary power load under normal conditions.
Apply and Save Changes:
Once you have made these changes, click Apply or Save to confirm the new configuration.
The interface may prompt for confirmation, after which the settings will be saved, and PSU2 will become the primary power supply under a 2+0 configuration.
Verify Configuration:
Review the updated settings to confirm that PSU2 is now set as primary and that the redundancy policy is 2+0, meaning only PSU2 is actively providing power without a secondary backup.
By following these steps in the iDRAC simulator, you will set up PSU2 as the primary power source with no redundancy, ensuring a 2+0 configuration. This setup will leverage PSU2 exclusively without automatic failover to another power supply.
An administrator has been tasked to create and save replacement of a server configuration with the file
name of "PE-server".
The profile must include the configuration for only the following components:
. NIC
. RAID
. iDRAC
Using the simulator, create and save the replacement with these components.
See the Explanation for Step by Step solution.
To create and save a server configuration profile with specific components in the iDRAC interface, follow these steps:
Step-by-Step Guide:
Access Configuration Profiles:
Go to the "Configuration" tab on the top menu bar.
From the dropdown options, select "Server Configuration Profile."
Create a New Profile:
Within the Server Configuration Profile section, choose the option to Create a New Profile.
You will likely see options to specify which components to include in the configuration profile.
Select Components:
When prompted, select only the components required for the configuration:
NIC: Network Interface Card settings.
RAID: Storage controller and RAID configuration.
iDRAC: iDRAC management settings.
Ensure that other components are not selected to meet the requirement.
Save the Configuration:
Enter the file name "PE-server" for the profile.
Choose the option to Save or Export the configuration profile. This should save the configuration to the specified name, typically on the server or local storage available through iDRAC.
Verify the Profile Creation:
After saving, verify that the profile appears in the list of server configuration profiles with the name "PE-server."
Confirm that it includes only the selected components.
By following these steps, you should successfully create and save the configuration profile with the specified components.
A system administrator is asked to create an iDRAC shared management port using LOM2 and
create a failover network using LOM3. Use the simulator to accomplish this task.

See the Explanation for Step by Step solution.
To configure an iDRAC shared management port with LOM2 and set up a failover network using LOM3 in the iDRAC interface, follow these steps:
Step-by-Step Guide:
Access iDRAC Network Settings:
In the iDRAC interface, navigate to the iDRAC Settings tab in the top menu bar.
Select Network from the dropdown options to access network configuration settings.
Configure the Shared Management Port:
In the Network settings, locate the section for Network Interface or LAN Interface Configuration.
Change the NIC Selection to Shared. This will enable the use of a LAN on Motherboard (LOM) port for iDRAC management.
Select LOM2 for the Shared Management Port:
Once you’ve selected Shared, additional options should appear for selecting the specific port.
Choose LOM2 as the Shared Management Port. This configures iDRAC to use LOM2 for its primary network connection.
Enable Failover and Select LOM3:
Look for the Failover settings within the same Network Interface configuration.
Enable Failover and select LOM3 as the failover network port. This configuration allows iDRAC to switch to LOM3 automatically if there is an issue with the connection on LOM2.
Save and Apply Settings:
Once you have configured the shared management port and failover settings, click Apply or Save to confirm the configuration.
The iDRAC interface may briefly refresh, and you should receive a confirmation that the settings have been applied successfully.
Verify Configuration:
After the settings are saved, you can verify that LOM2 is listed as the shared management port and that LOM3 is set as the failover port under Network settings.
By following these steps in the simulator, you should be able to configure iDRAC to use LOM2 for the shared management port and set up a failover network with LOM3. Make sure to save your changes to apply the configuration.
Due to recent security breaches and to avoid accidental changes made by the junior IT staff, an
administrator would like to prevent unwanted configuration changes in the iDRAC UI.

See the Explanation for Step by Step solution.
To prevent unwanted configuration changes in the iDRAC UI, you can adjust user roles, permissions, or enable specific security settings to restrict access for junior IT staff. Here are the steps to secure the iDRAC configuration:
Step-by-Step Guide:
Access User Settings:
In the iDRAC interface, navigate to iDRAC Settings from the main menu.
Choose User Authentication or Users to manage user accounts and permissions.
Adjust User Roles and Permissions:
Identify the accounts associated with junior IT staff.
For each user account, adjust the role to Read-Only if you want them to have view-only access without making configuration changes.
Alternatively, set their permissions to exclude configuration changes. This may involve assigning a custom role with limited access based on your needs.
Enable Configuration Lock (if available):
Some versions of iDRAC offer a Configuration Lock feature, which prevents any configuration changes until the lock is removed by an administrator.
Navigate to Configuration > System Security or User Authentication, depending on the version, and enable the Configuration Lock option.
Set Up Two-Factor Authentication (Optional):
For added security, enable Two-Factor Authentication under iDRAC Settings > Network or Security settings. This step ensures only authorized users can access and make changes to the iDRAC UI.
Save and Apply Security Changes:
After setting up the desired restrictions and permissions, save the settings to apply the changes.
Verify that junior IT staff accounts now have restricted access and cannot make configuration changes.
Log Out and Test the Changes:
Log out of the administrator account and log in with a junior IT staff account to confirm that the permissions are set correctly.
Ensure that configuration changes are disabled and that the user can only view the iDRAC interface as per the restrictions.
By following these steps, you can restrict junior IT staff from making any configuration changes within the iDRAC interface, thus preventing accidental or unauthorized modifications.
Copyright © 2014-2025 Examstrust. All Rights Reserved